Dataverse Meets Fabric - What About Monitoring?
Learn how to monitor your Dataverse-to-Fabric integration—whether via Synapse Link or Direct Link. From system table tracking to custom alerting, this article helps you ensure your data pipeline stays healthy and up-to-date.

Introduction
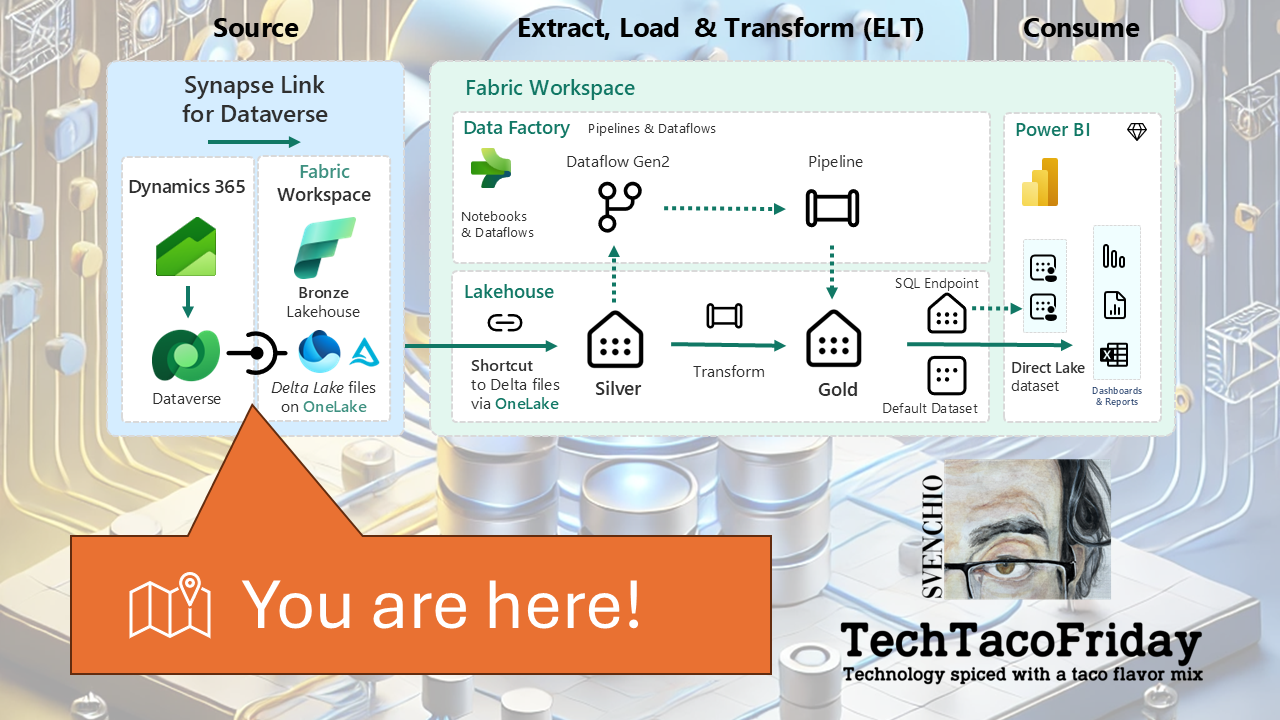
So, you’ve got your Dataverse data flowing into Microsoft Fabric—whether through Azure Synapse Link or the Direct Link to Fabric... Congratulations 🥳!!! I genuinely believe you’ve made a strong, forward-thinking architectural choice!
But setting up the pipeline is just the beginning, now comes the part that often gets overlooked: making sure it stays healthy; because once data is flowing, the question quickly shifts from "Can we get the data in? " to "How long has it been since the data was last refreshed or updated from its source? How do we know it’s still working?"
How you monitor your Dataverse-to-Fabric integration depends largely on which link method you’ve implemented. In this section, I’ll outline monitoring strategies tailored to each approach... jump to the section that matches your setup—or explore both to better understand the trade-offs.
Monitoring Azure Synapse Link for Dataverse
Infrastructure Layer
The backbone of your data synchronization is the Azure Synapse Analytics workspace, in other words, we need to first stablish monitoring on this resources! As a topic, Azure Monitoring is huge! However, I'm going to get you started with the following essential topics:
- Use Log Analytics Workspace to collect logs/metrics because allows you to centralize, query, and analyze logs and metrics from multiple Azure resources in one place, enabling advanced monitoring, alerting, and troubleshooting; It supports powerful Kusto-based queries, long-term retention and will allow you to configure alerts.
- Create alerts for monitoring Azure resources to be immediately notified of critical issues or threshold breaches, allowing you to respond quickly to service disruptions, performance degradation, or security risks reducing the impact of potential failures.
In order to help you achieve these two, I included on the code a module to add a Log Analytics workspace and to configure your Synapse Workspace to send metrics (1) and Synapse Link Events.
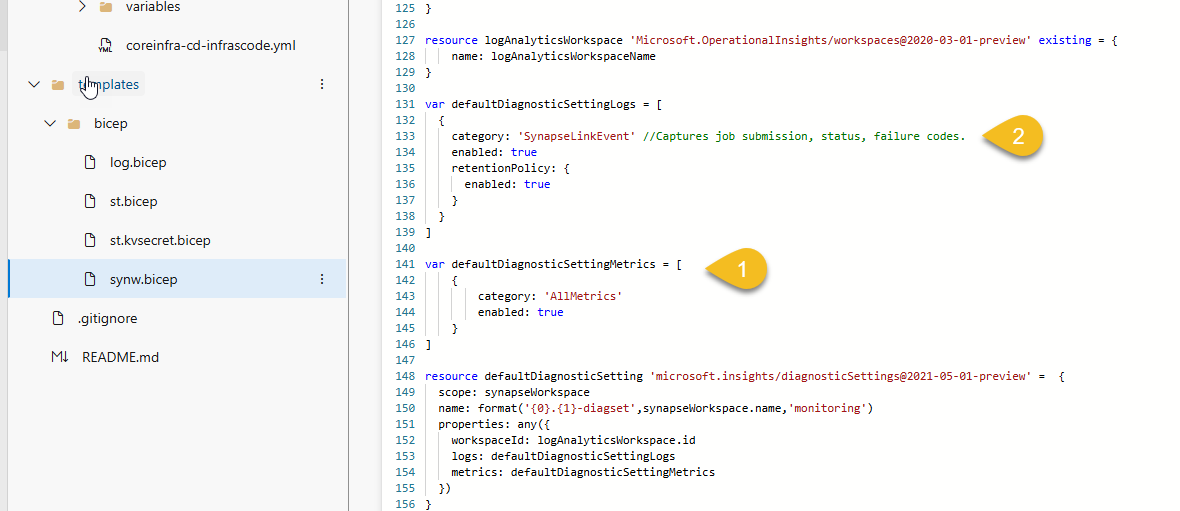
From here you can create both metric and log search alerts to keep an eye not only to your Synapse Workspace but your hole Azure Infrastructure 🤞
Application Layer
Assuming the infrastructure is functioning correctly, the next focus is on the synchronization status of individual tables within Dataverse. Microsoft provides system tables that offer real-time insights into the sync status:
SynapseLinkProfileEntityState: This table provides information about the initial synchronization status of each table.
SynapseLinkExternalTableState: This table offers details about the external tables in the Synapse workspace, including their synchronization status and metadata
By monitoring these tables, you can detect anomalies such as delayed syncs or failed updates. For proactive monitoring, consider setting up Power Automate flows that trigger alerts based on specific conditions (e.g., SyncState not equal to 'Completed' or LastSyncedDataTime exceeding a threshold).
While you can't directly expose that table to Fabric, here’s what you can do:
- Use Power Automate to query these tables and log the results into a custom table, Dataflow, or even Azure Log Analytics.
- Then link that custom table to Fabric—effectively creating a monitoring bridge.
Here's how you can set up a simple monitoring bridge:
Step 1 - Create a Custom Table. Add these columns: EntityName (Text), SyncState (Text), LakeRecordCount (Whole Number), LastSyncedDataTime (DateTime), LoggedTime (DateTime)
Step 2 - Build a Power Automate Flow. Create a Scheduled Flow (e.g., run every 30 minutes) and loop through the results use “Add a new row” action to insert into your custom table
Step 3 - Link to Fabric. Assuming you're already syncing the environment via Synapse Link, just enable sync for your custom table; the sync data will now appear in your Fabric Lakehouse, where you can build Power BI dashboards or monitor freshness via Direct Lake
Monitoring Link to Microsoft Fabric (Direct)
For the "Link to Microsoft Fabric (Direct)" method, Microsoft has not provided specific documentation on monitoring synchronization status or setting up alerts. However, you can monitor the synchronization status manually by:
- Navigating to the Power Apps maker portal
- Selecting your environment and clicking on Tables.
- Choosing Analyze and then Link to Microsoft Fabric,
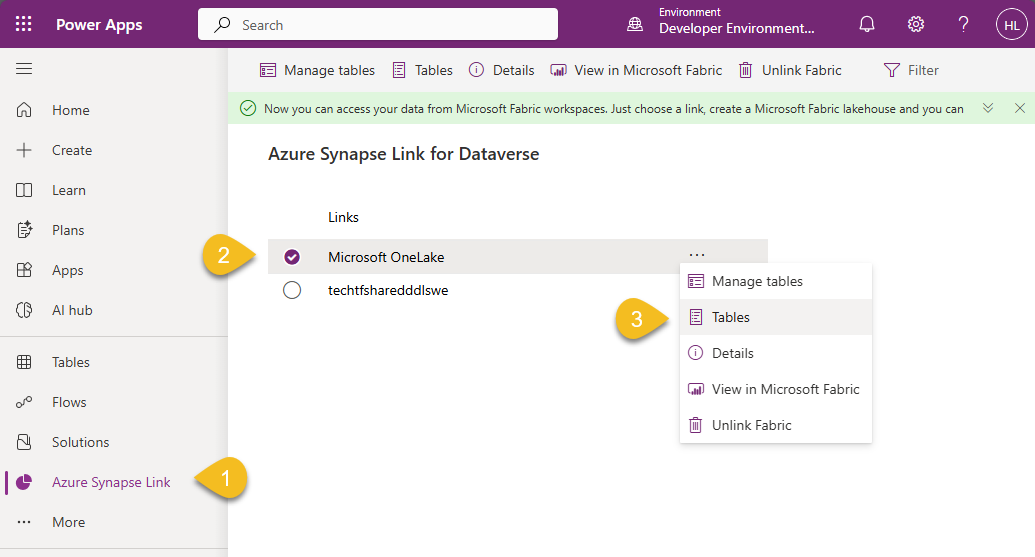
- Reviewing the sync status of each table.
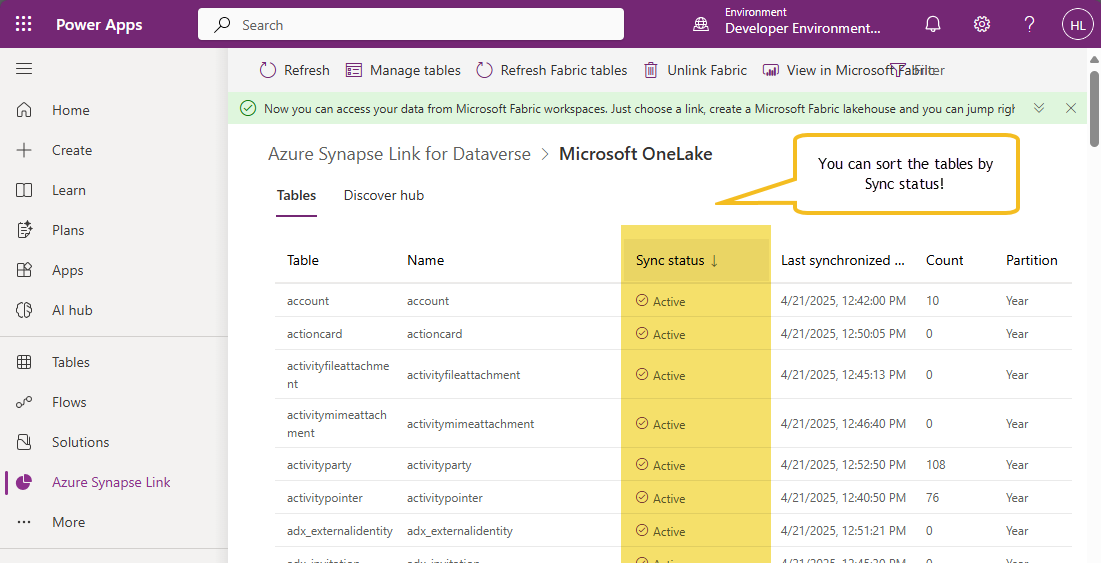
While this method doesn't provide automated alerts, it allows you to check the current synchronization status.
If automated monitoring is essential for your operations, consider implementing custom solutions like Fabric Lakehouse Validation by creating a Fabric notebook or pipeline that periodically checks:
- Last modified times of the Delta tables
- Row counts or file timestamps in the storage layer
Wrapping Up!
Monitoring often gets left out of early architectural discussions—but it’s crucial for keeping your Dataverse-to-Fabric integration running smoothly over time.
Whether you're using Azure Synapse Link or the Direct Link to Fabric, each method requires a different mindset and toolset for tracking data flow, sync health, and freshness.
Remember: setting up the pipeline is just the beginning. Maintaining it is what makes it production-grade.
This concludes the Dataverse Meets Fabric series... from strategy to setup, and now monitoring—you’re ready to build Fabric-native analytics on top of your operational data.
Thanks for following along—and as always, I’d love to hear how you’re putting these patterns into practice.