Lab 2: Handle a continuous stream of real-time data
Learn how to handle a continuous stream of real-time data in Microsoft Fabric. In this lab, you’ll create an Eventstream, apply transformations, route data to a KQL database, and explore streaming insights using KQL queries.


This is the Lab 2 out of 5 of the series...
- ⏮️ Previous Lab 1: Exploring Real-Time Intelligence Experience
- ⏭️ Next Lab 3: Eventstream to ingest additional data into your existing Eventhouse
Contents
- Introduction
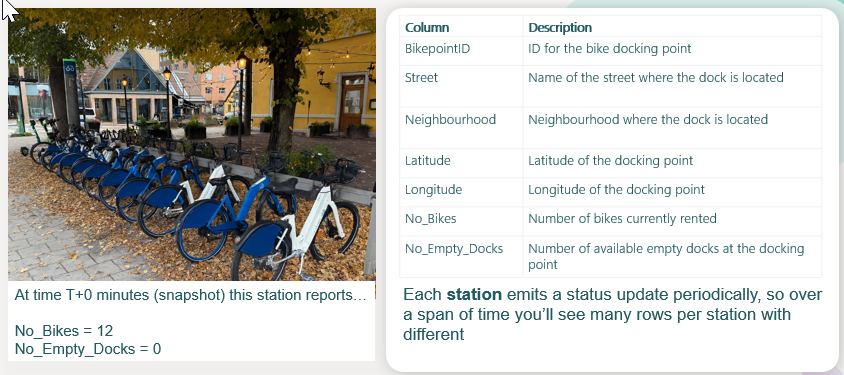
- Understanding the streaming dataset
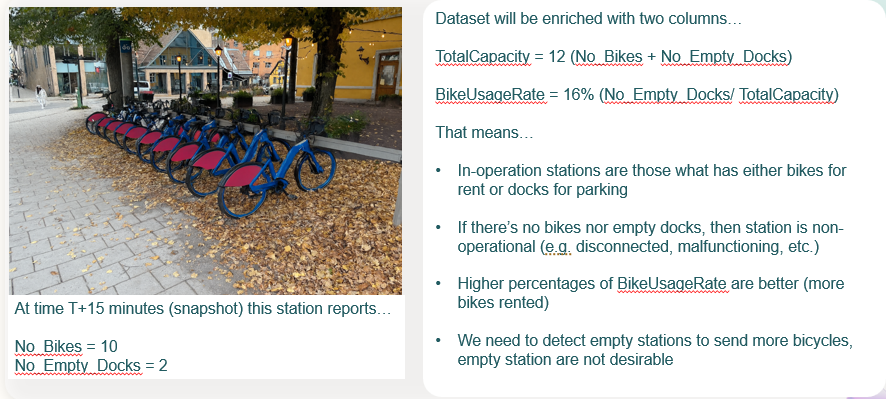
- Streaming dataset enrichment
- Eventstream
- Task 1: Create an Eventstream Source
- Task 2: Setup Eventstream Transformation events
- Task 3: Setup Eventstream Transformation destinations
- KQL Database
- Task 4: Exploring the KQL Database
- Task 5: Learning to write KQL
Introduction
In this lab, you will experience a way to handle a continuous real-time data stream; you will use a Fabric Real-Time Intelligence item called an Eventstream to ingest this data to the Eventhouse created in the last lab and write some basic KQL queries.
Understanding the streaming dataset
It is important to understand the data, the Bicycle rentals sample provides a pre-configured, continuously streaming dataset that simulates real-world bike station telemetry. It includes live updates on bike availability, dock availability, and station status across various locations in London.
Streaming dataset enrichment
As part of the lab, we will also "enrich" the streaming dataset with some additional calculation that we will use in the following labs
Eventstream
Task 1: Create an Eventstream Source
In this task you will create an Eventstream with a data source from Azure Event Hub.
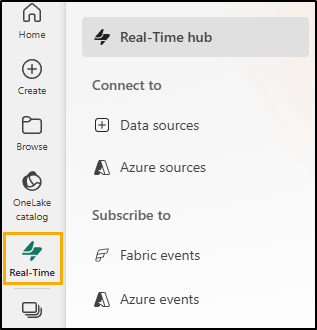
#1. Open your Lab's Fabric workspace, from here we can see the Eventhouse we created... navigate to the Real-Time Hub by selecting the Real-Time button on the left-hand side. If the Welcome to Real-Time Hub dialog will appear, check the box for Don't show again and then click Get Started.
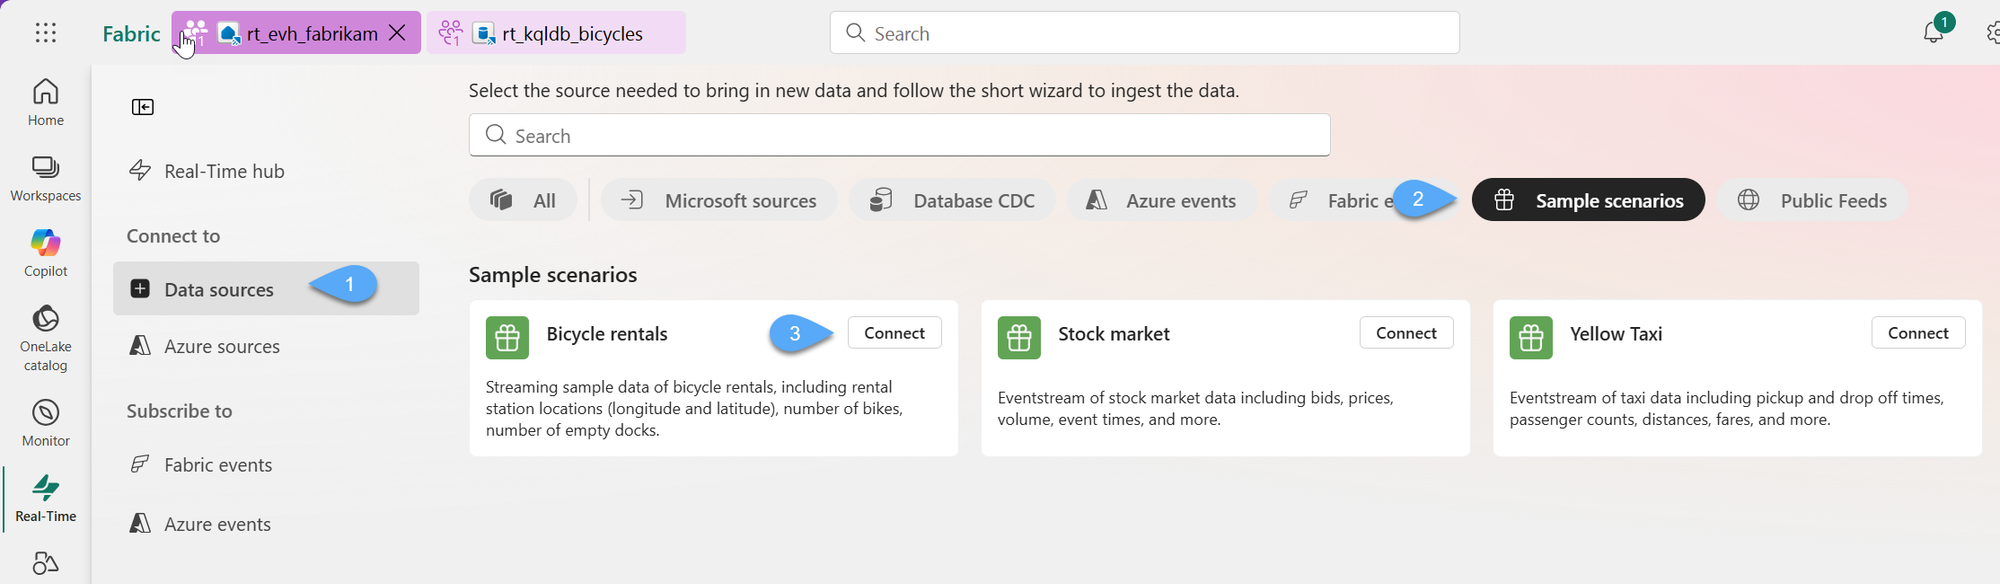
#2. Click on [+] Data Sources 1️⃣, then on Sample scenarios and from Bicycle rentals, click Connect 3️⃣
#3. Name the Source name as sample-data and then click on Edit Eventstream name 2️⃣ and rename as rt-evs-bicycles and click Next 3️⃣
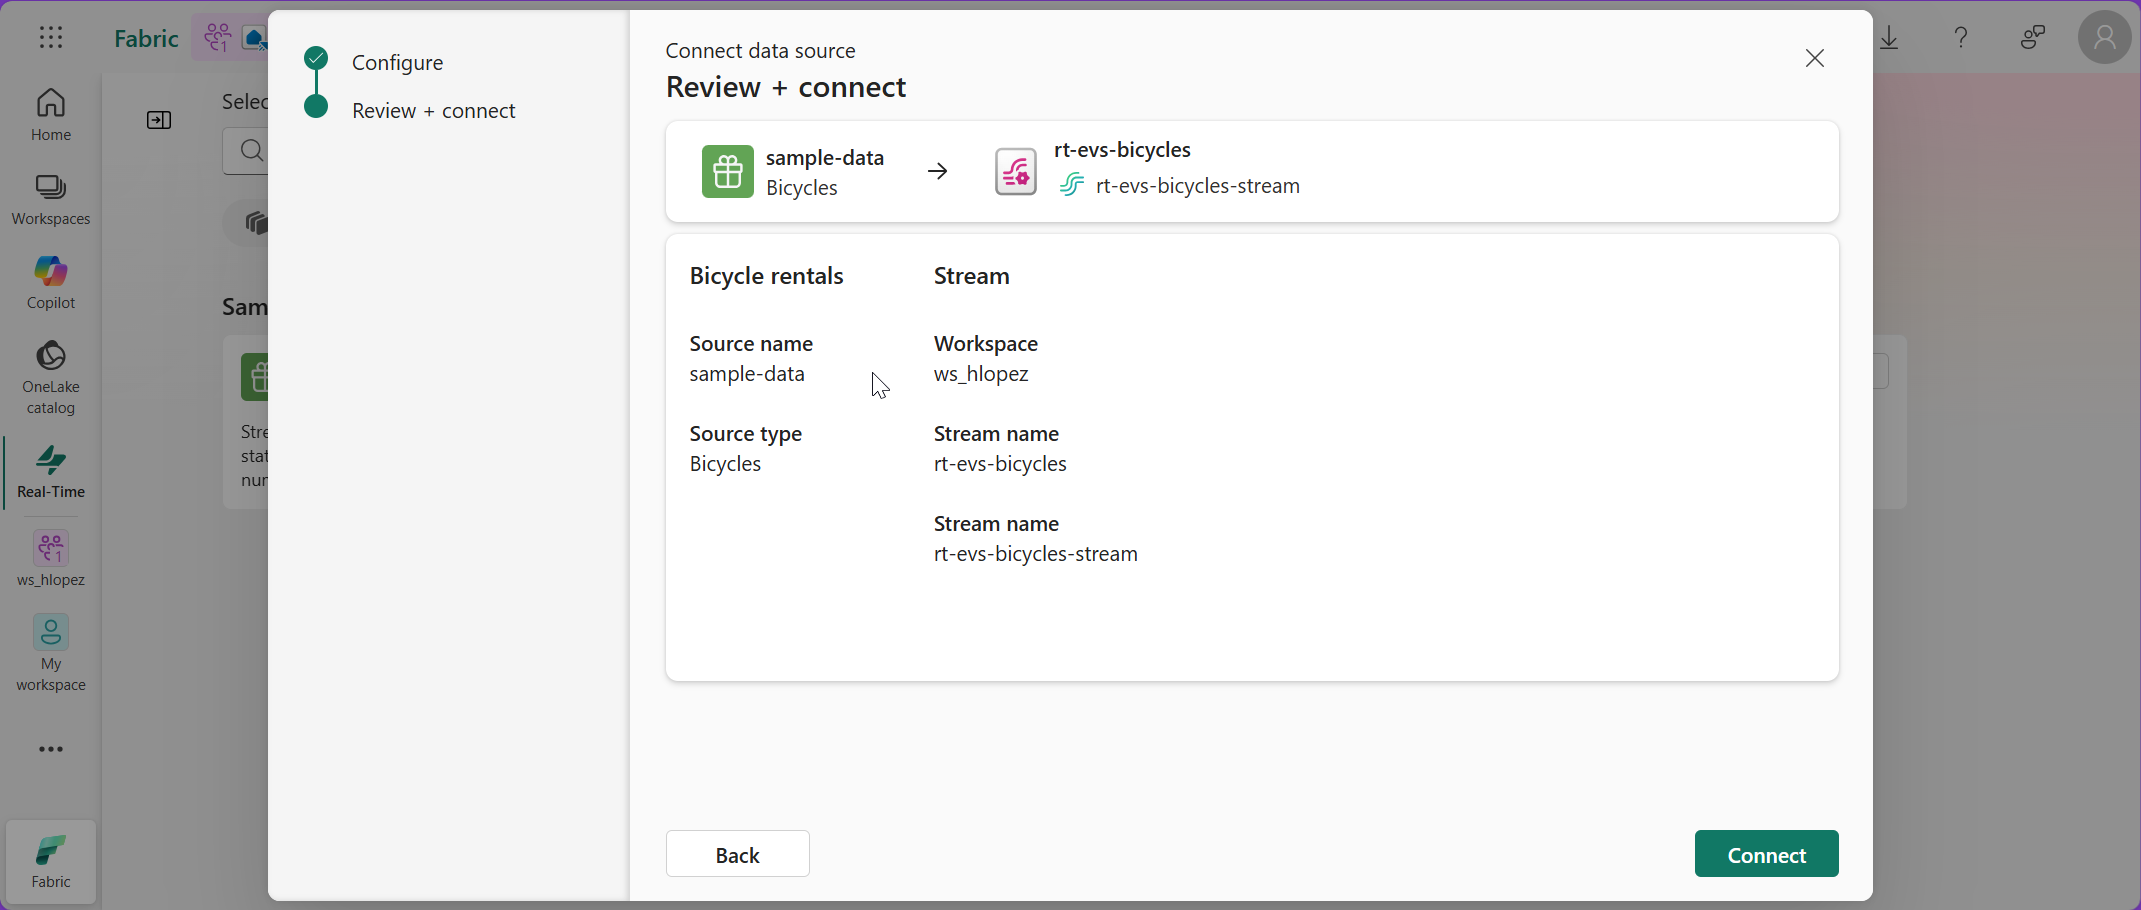
#4. Confirm the new Event stream information (workspace, source and stream names) and Connect
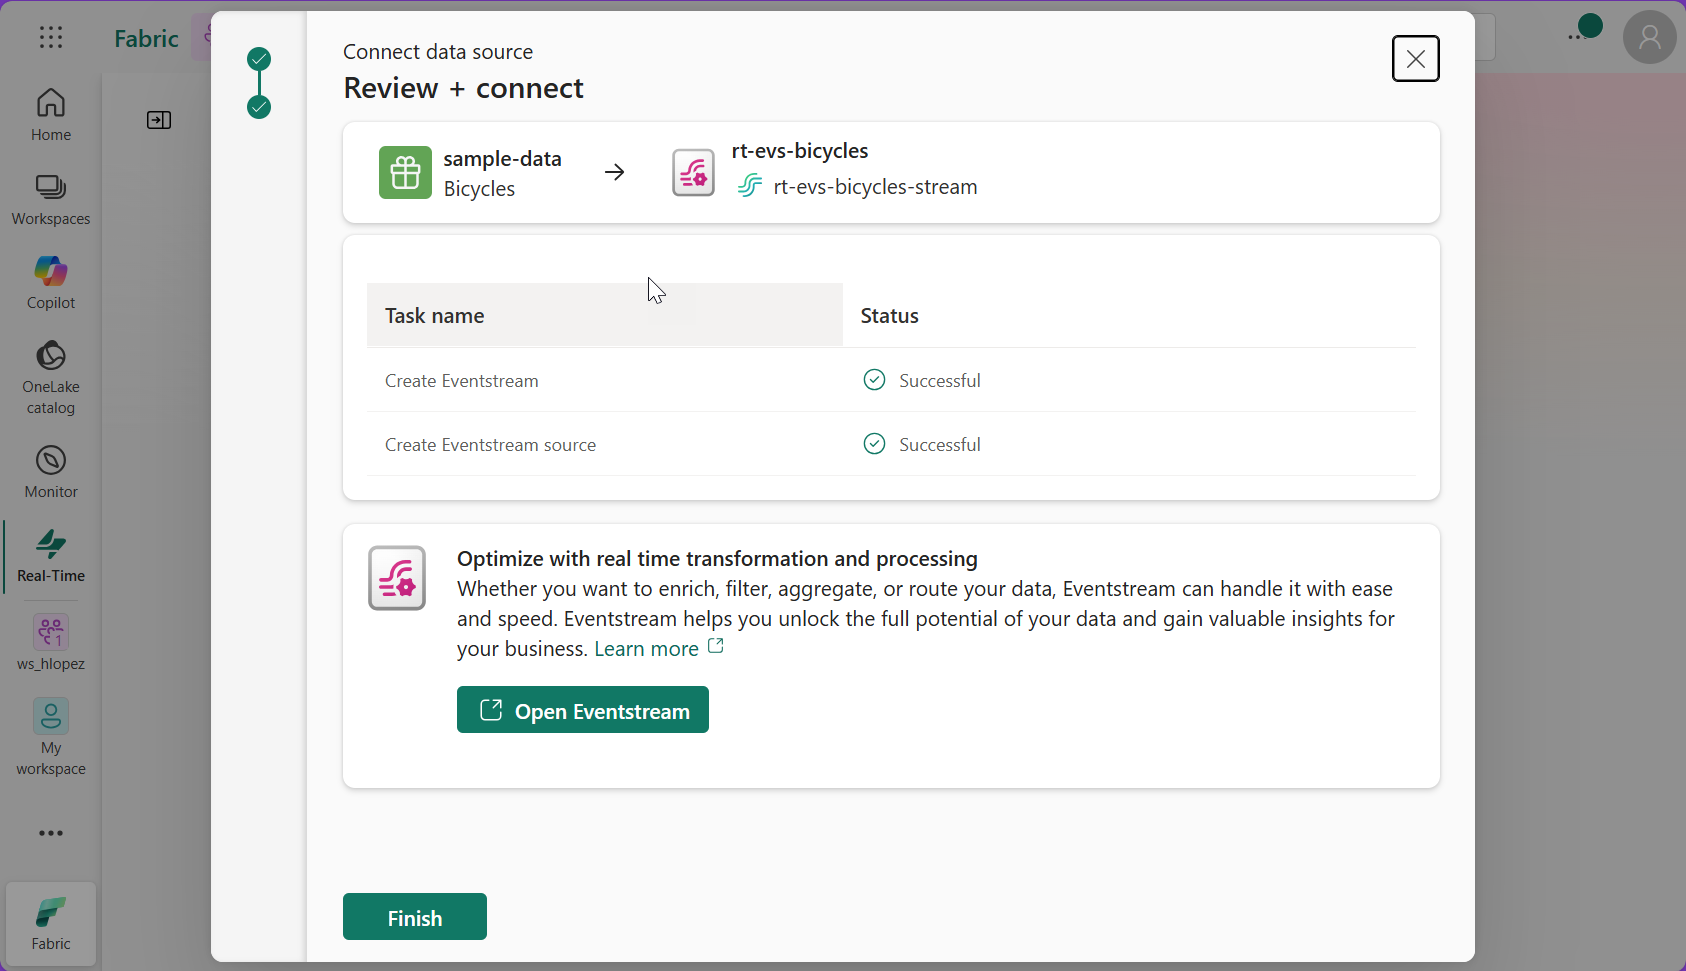
#5. Wait for the process to complete; once the Eventstream and Eventstream source are created select the option "Open Eventstream" - This will take you to the Eventstream user interface. Here is where you will see your source stream of data flowing and add transform events as well.
#6. It may take a few moments for your Source to be Active but after waiting a few moments, click on the middle icon with the name of your Eventstream on it and you should see a preview of the data. If the data does not appear in the data preview window, you can select Refresh. You should now see a sample of the data within the bottom window.
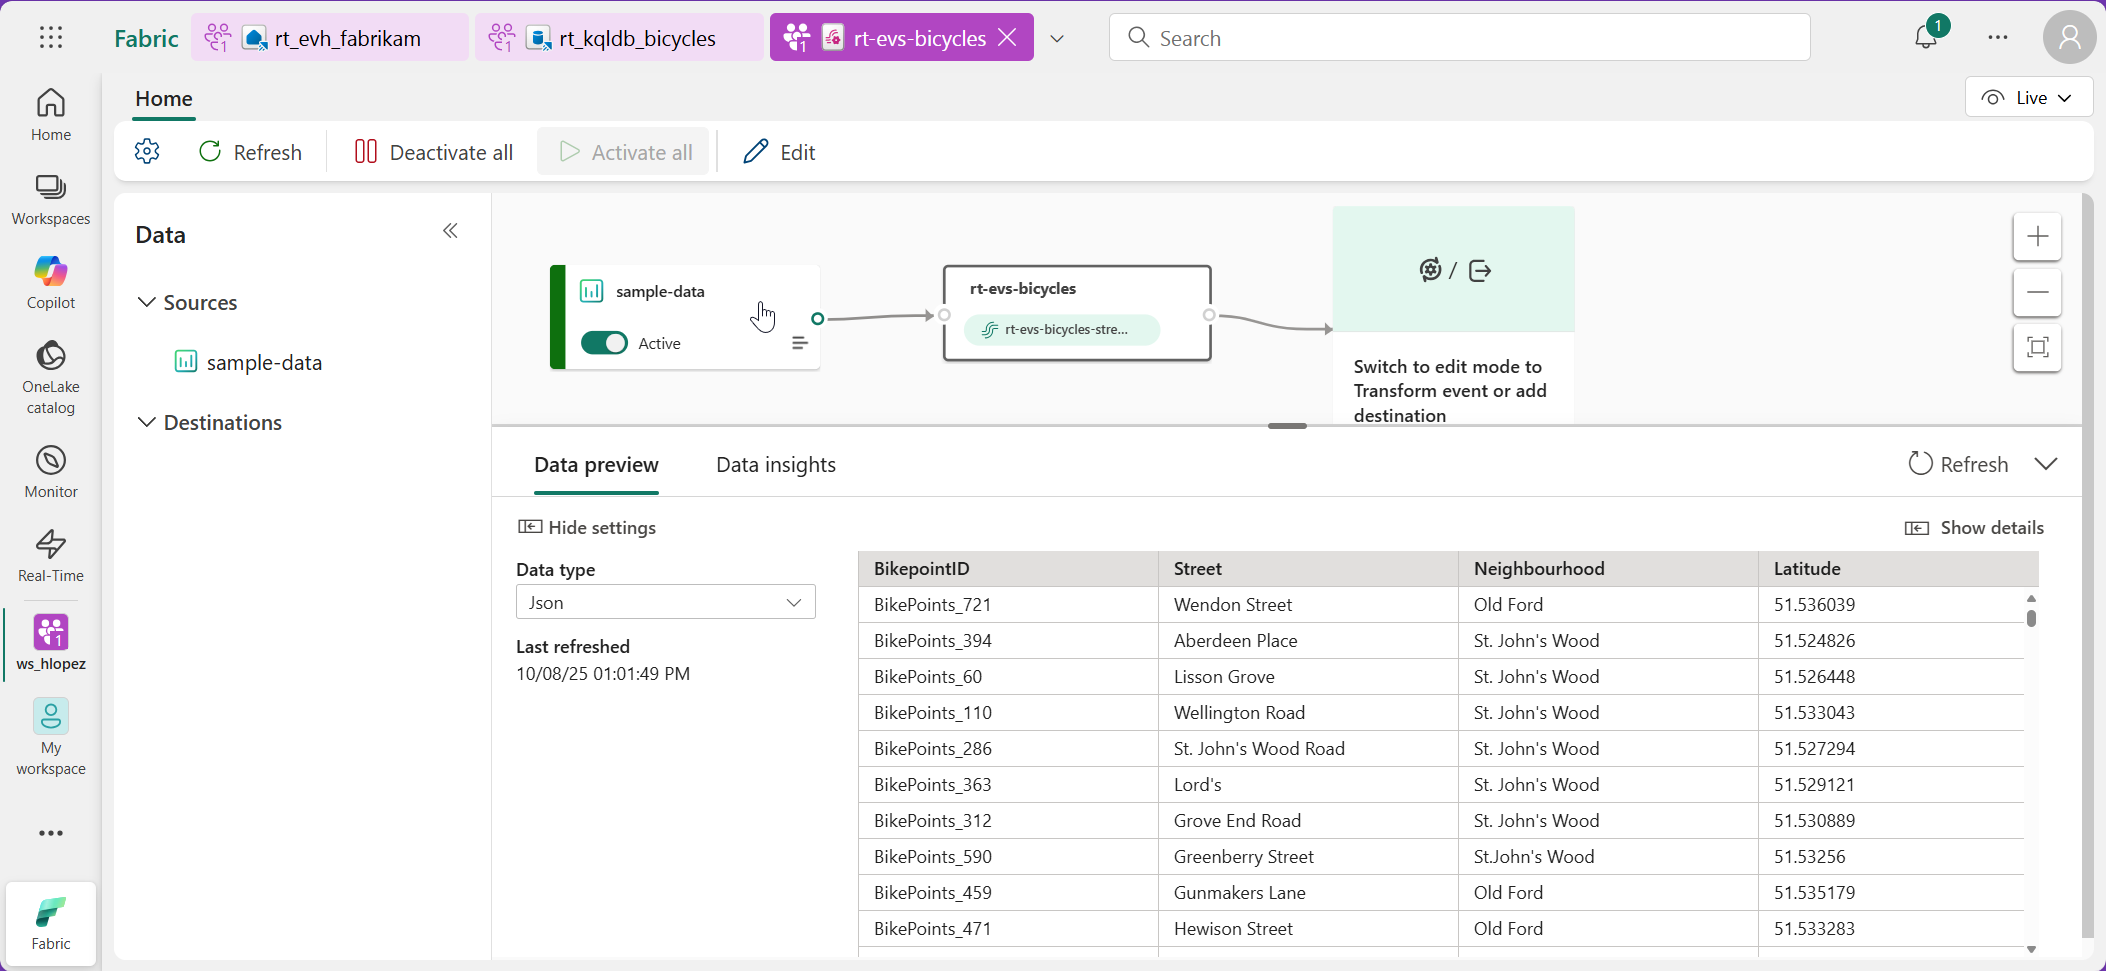
#7. This will show you a preview of the data that is being received from the Azure Event Hub. If you slide your bottom horizontal scroll bar all the way to the right-side of your preview, you will be able to see the time that the data has been received in the Event Hub in two columns:
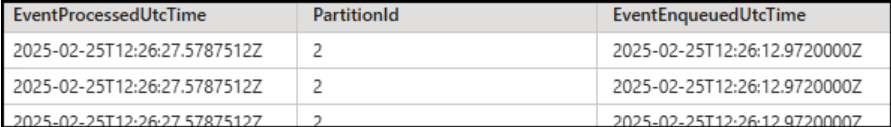
- EventProcessedUtcTime is a system-generated timestamp, it reflects the moment the data was ingested not when it was created at the source.
- EventEnqueuedUtcTime represents the timestamp when the event was first received by the message broker (like Azure Event Hub), it helps you understand when the data entered the pipeline.
Task 2: Setup Eventstream Transformations events
In this task, you will be using transform events to separate the bike stations that are currently in-operation vs the ones that are not-in-operation; these transform events will run simultaneously in your event stream
- filter_and_enrich_in_operation. Streaming data indicating either bicycles available for rent or docks to park, in addition, we will add some additional calculations.
- filter_non_operational. Streaming data indicating neither bicycles nor docks available
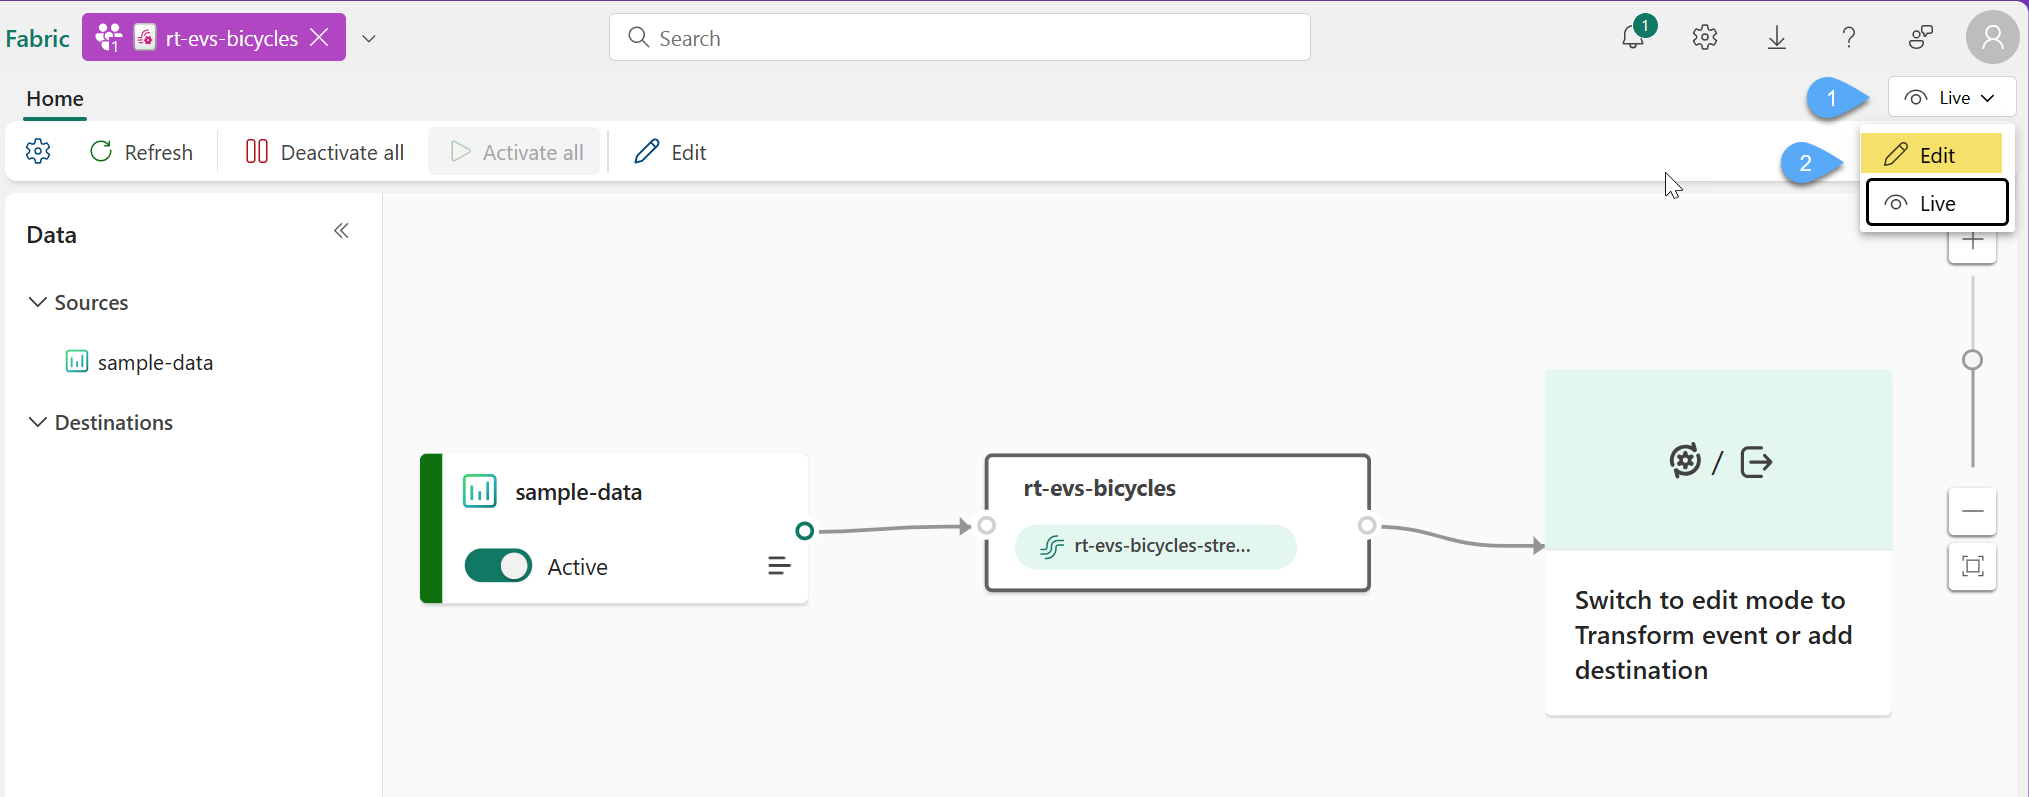
#1. Enter the evenstream edit mode by clicking on the mode selector 1️⃣ and select Edit 2️⃣
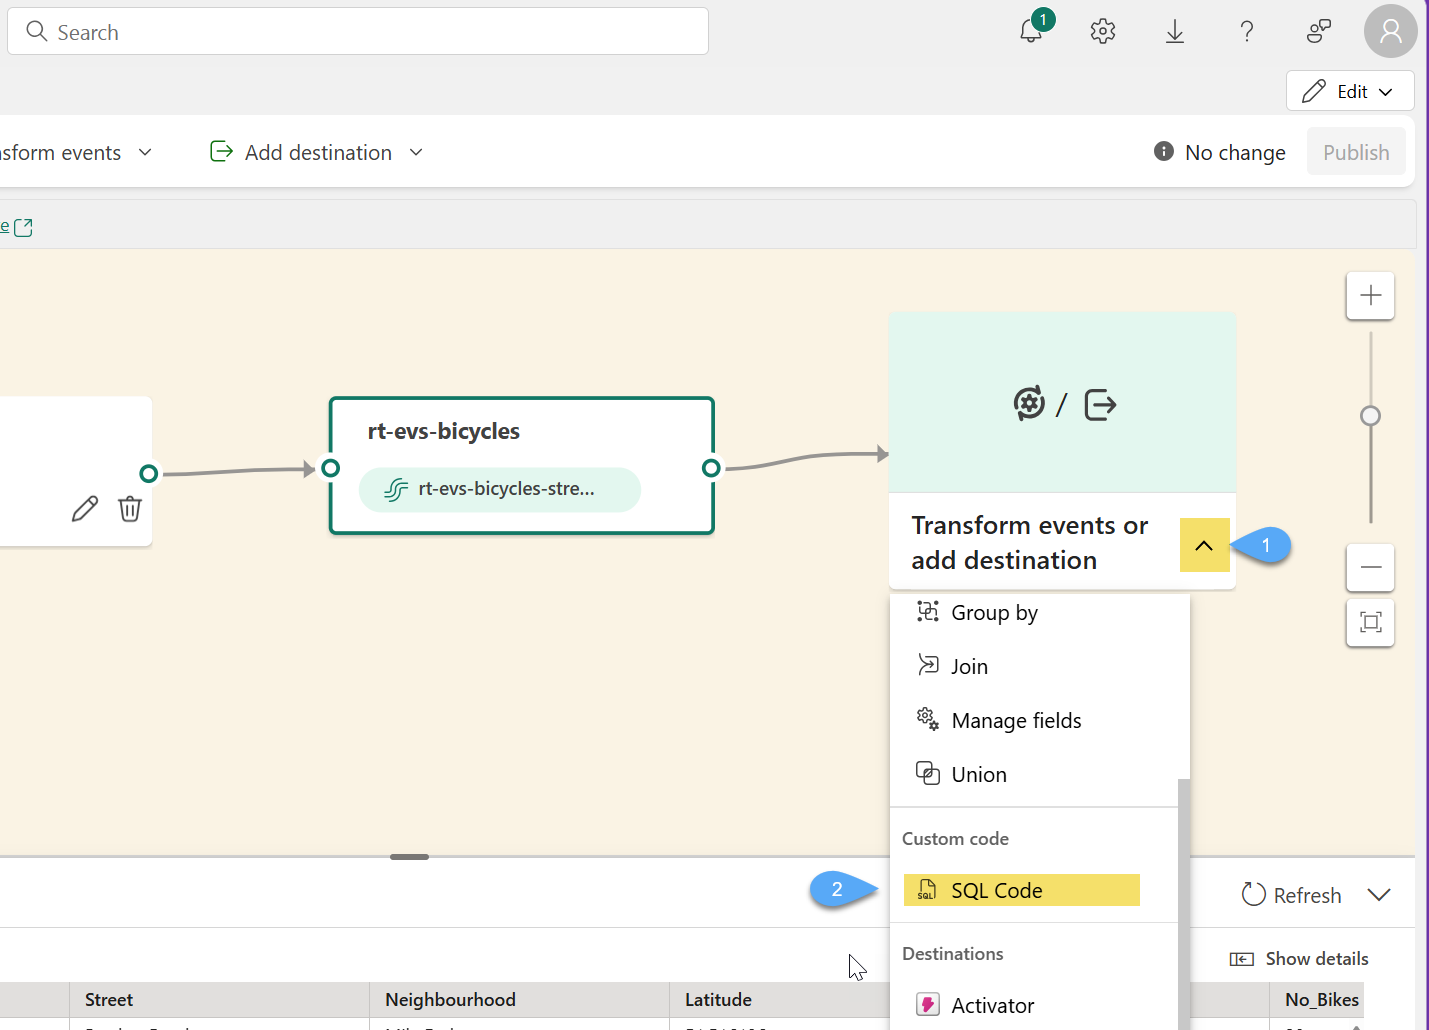
#2. Click on the tile within the canvas area labeled "Switch to edit mode to Transform event or add destination" 1️⃣ and select SQL Code
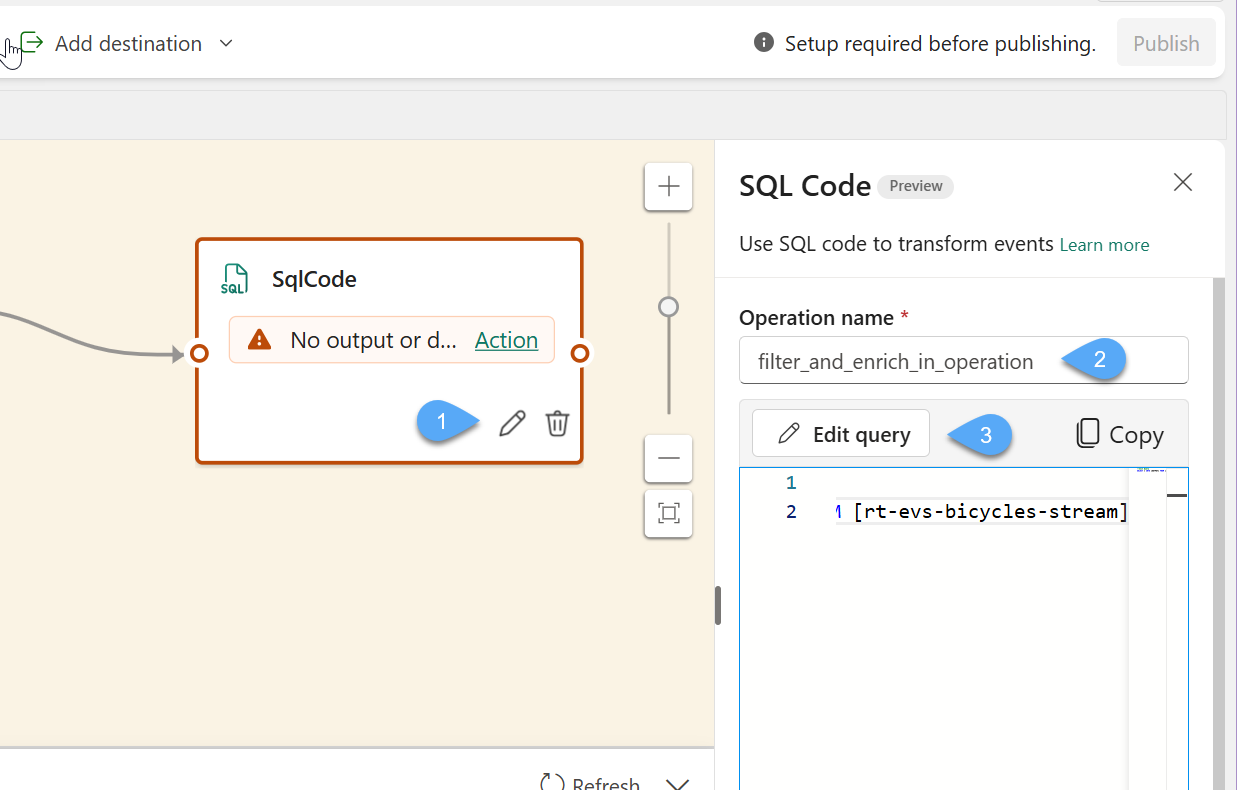
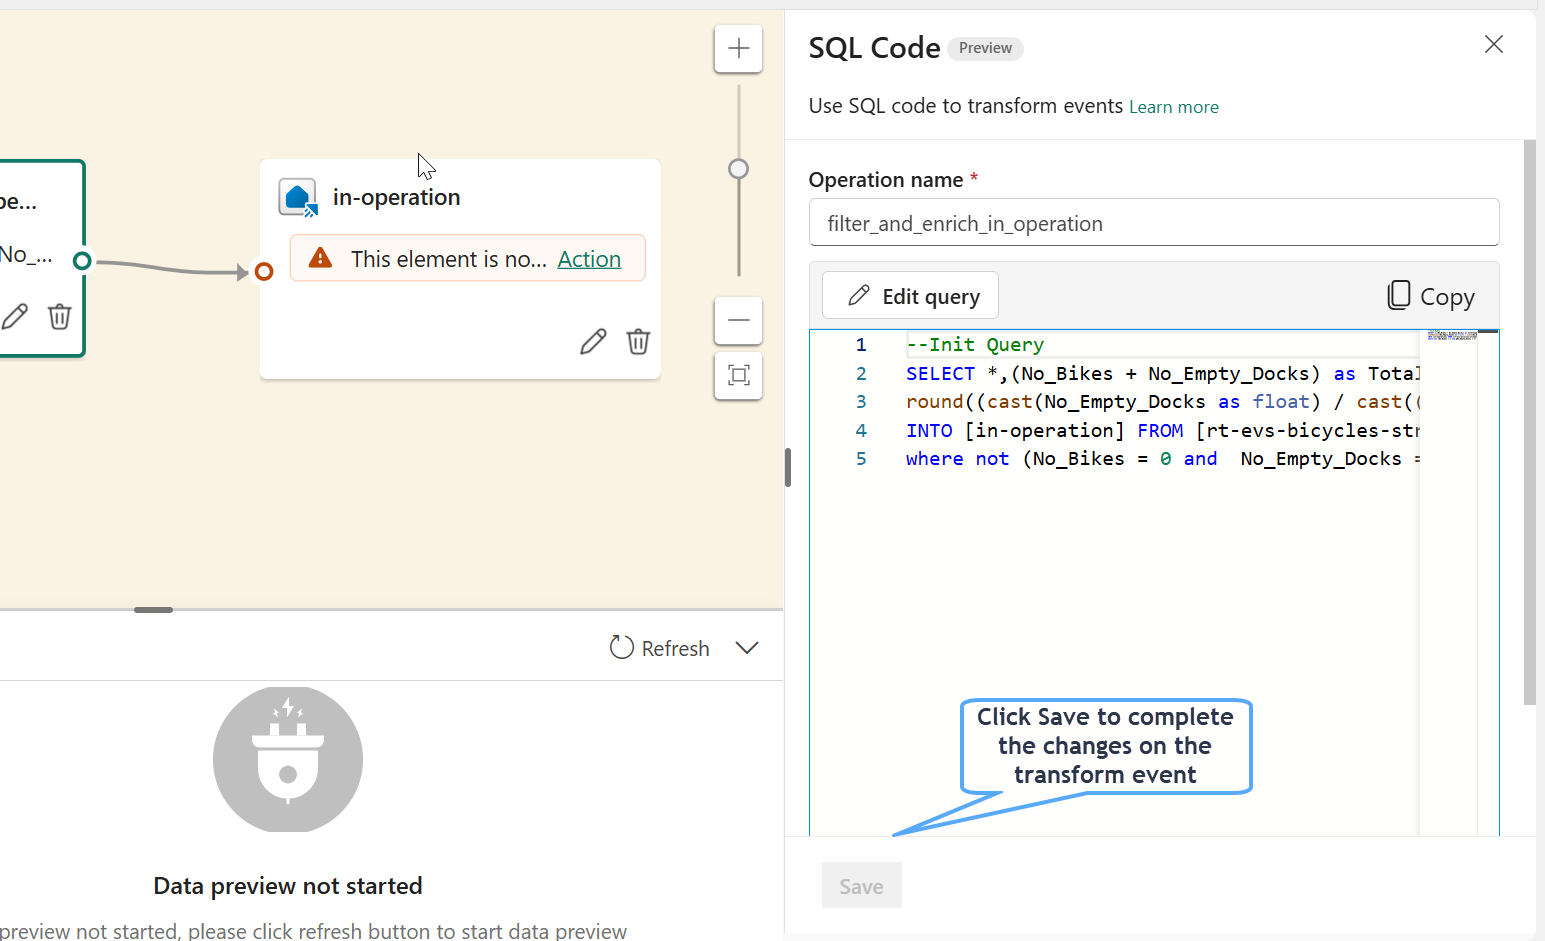
#3. From the SqlCode transform event, click on Edit 1️⃣, rename the operation to filter_and_enrich_in_operation 2️⃣ and click on Edit query
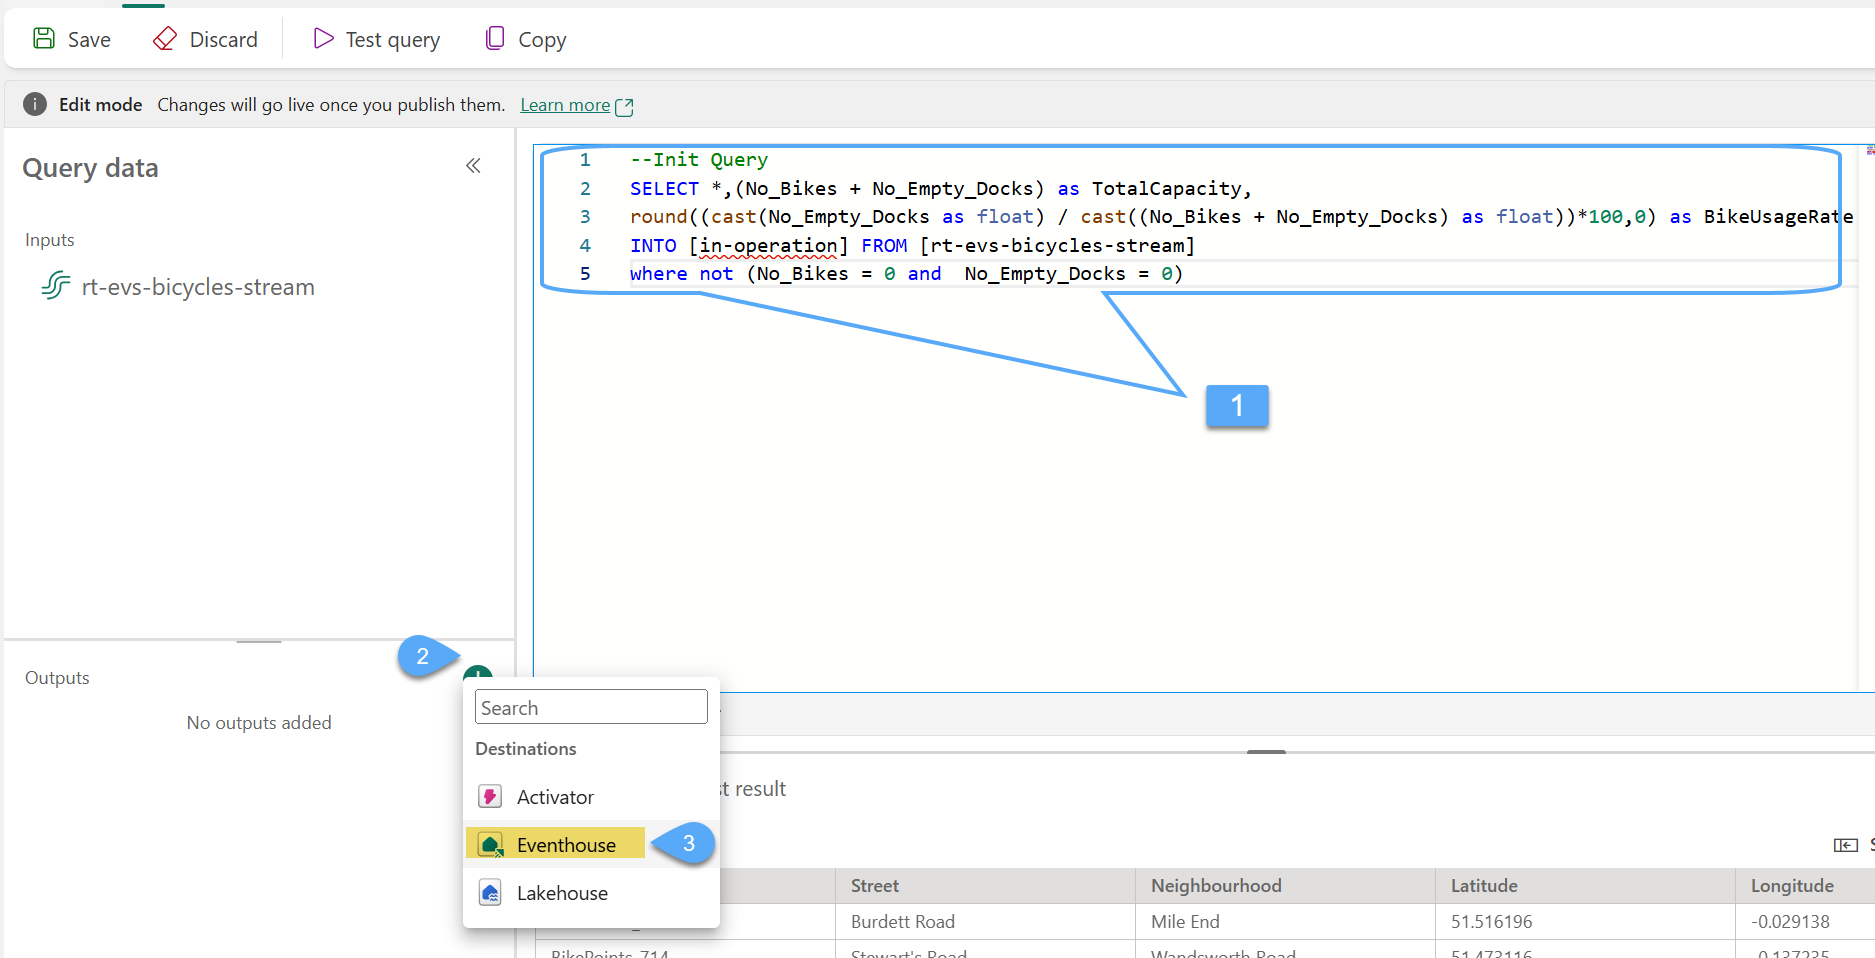
#4. Copy & paste the following SQL Query 1️⃣, then click on the plus sign 2️⃣ and select Eventhouse 3️⃣
/*
SQL query selects streaming data, calculates total capacity and bike usage rate for each docking station,
and filters out stations with no bikes and no empty docks.
*/
SELECT *, (No_Bikes + No_Empty_Docks) as TotalCapacity,
   round((cast(No_Empty_Docks as float) / cast((No_Bikes + No_Empty_Docks) as float))*100,0) as BikeUsageRate
INTO [in-operation] FROM [rt-evs-bicycles-stream]
where not (No_Bikes = 0 and  No_Empty_Docks = 0);
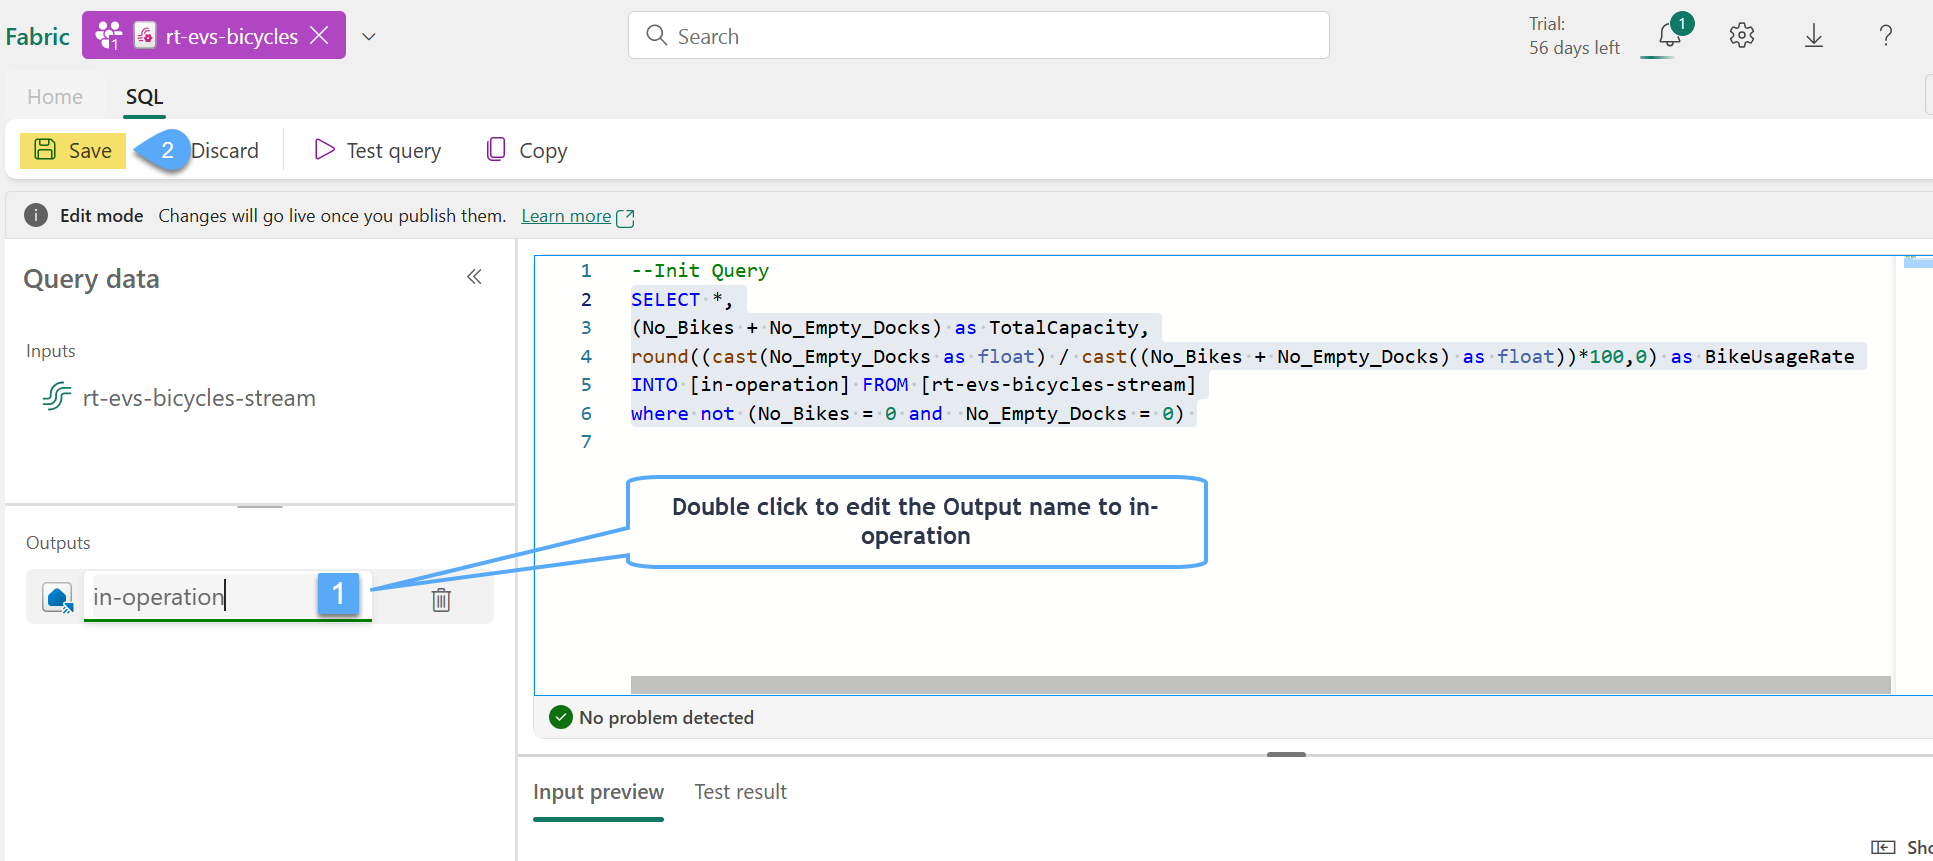
#5. Double click on Outputs and rename to in-operation 1️⃣ and Save 2️⃣
#6. Click Save on your way back to the transform event editor
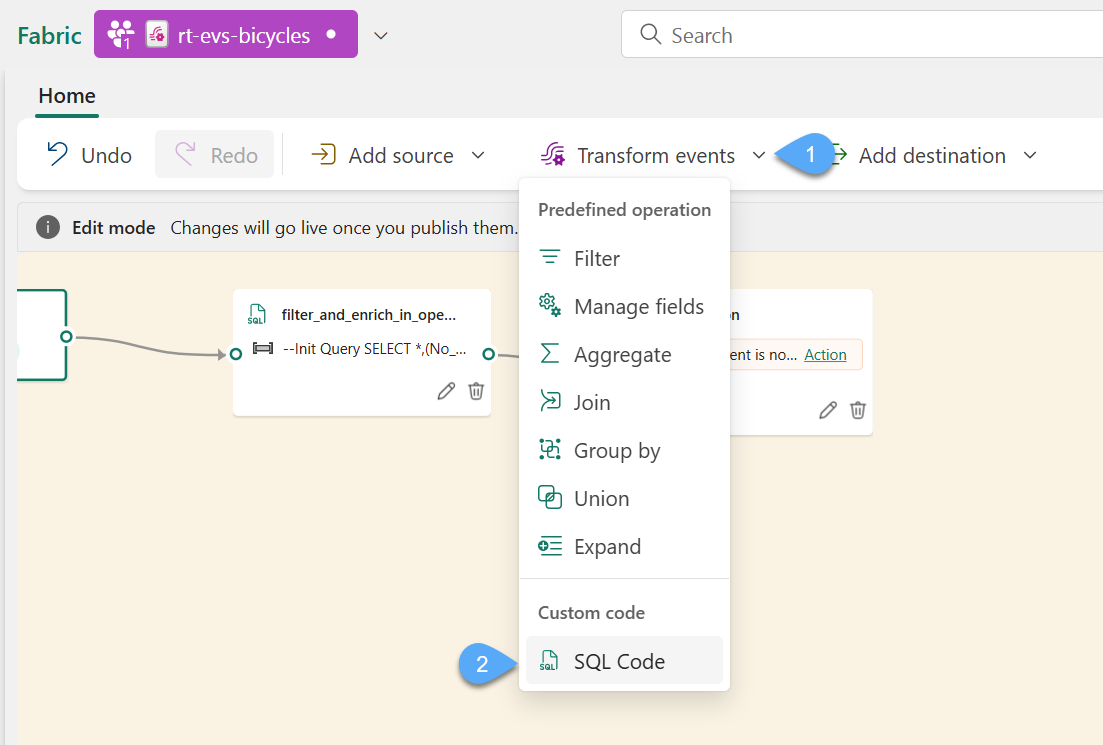
- Click on Transform events 1️⃣ and select SQL Code 2️⃣
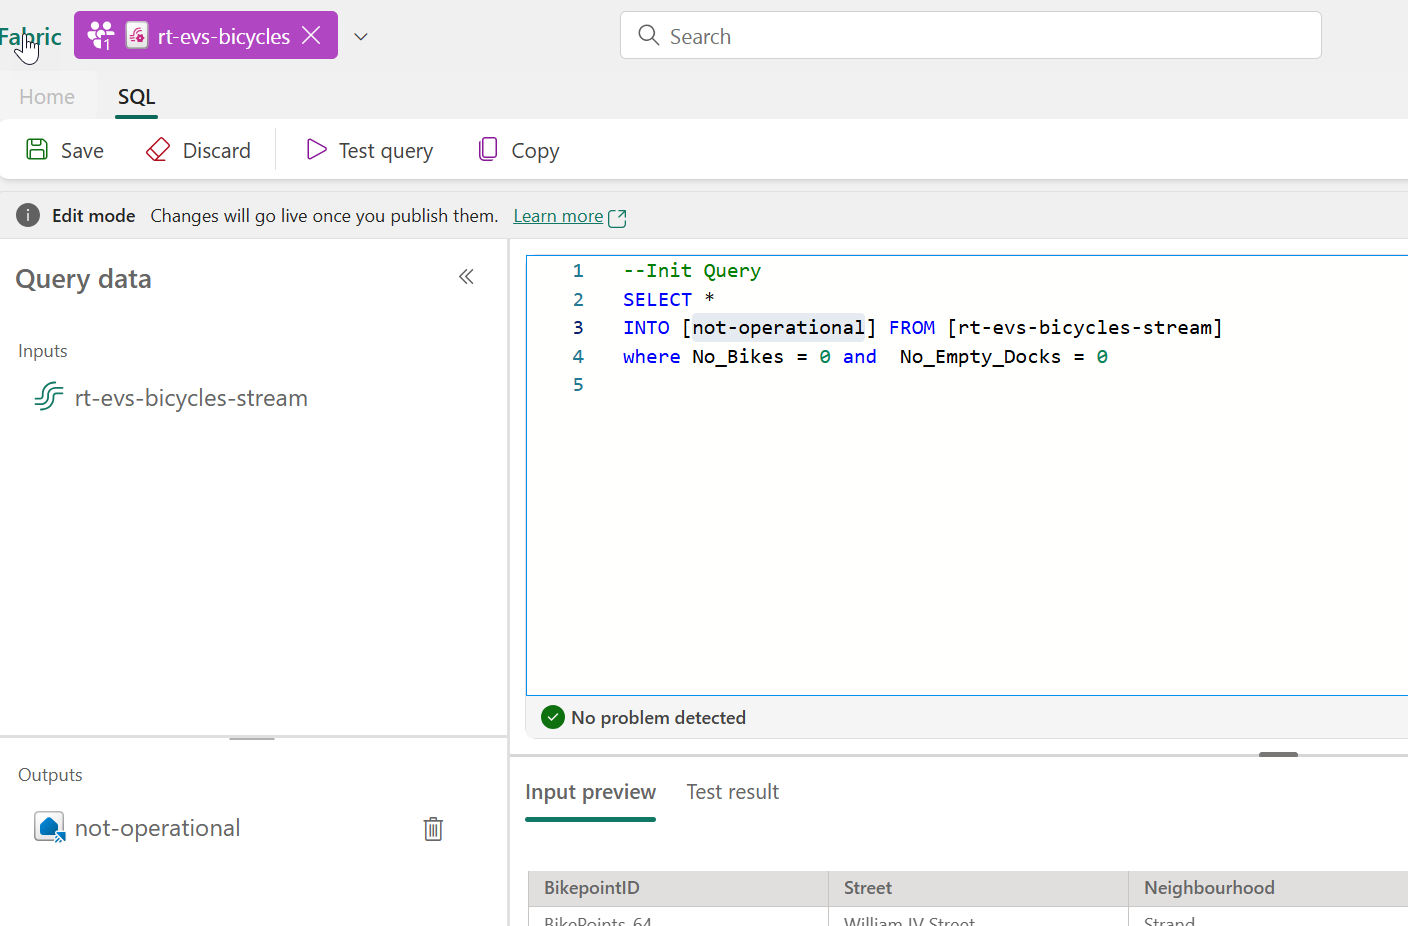
#8. Repeat the steps 3 thru 6 again to add the filter_non_operational using the following config. instead:
a. Rename the operation as filter_non_operational
b. Use the following sql instead
--SQL query selects streaming data for stations with no bikes and no empty docks.
SELECT *
INTO [not-operational] FROM [rt-evs-bicycles-stream]
where No_Bikes = 0 and  No_Empty_Docks = 0
c. Add and name the output as not-operational
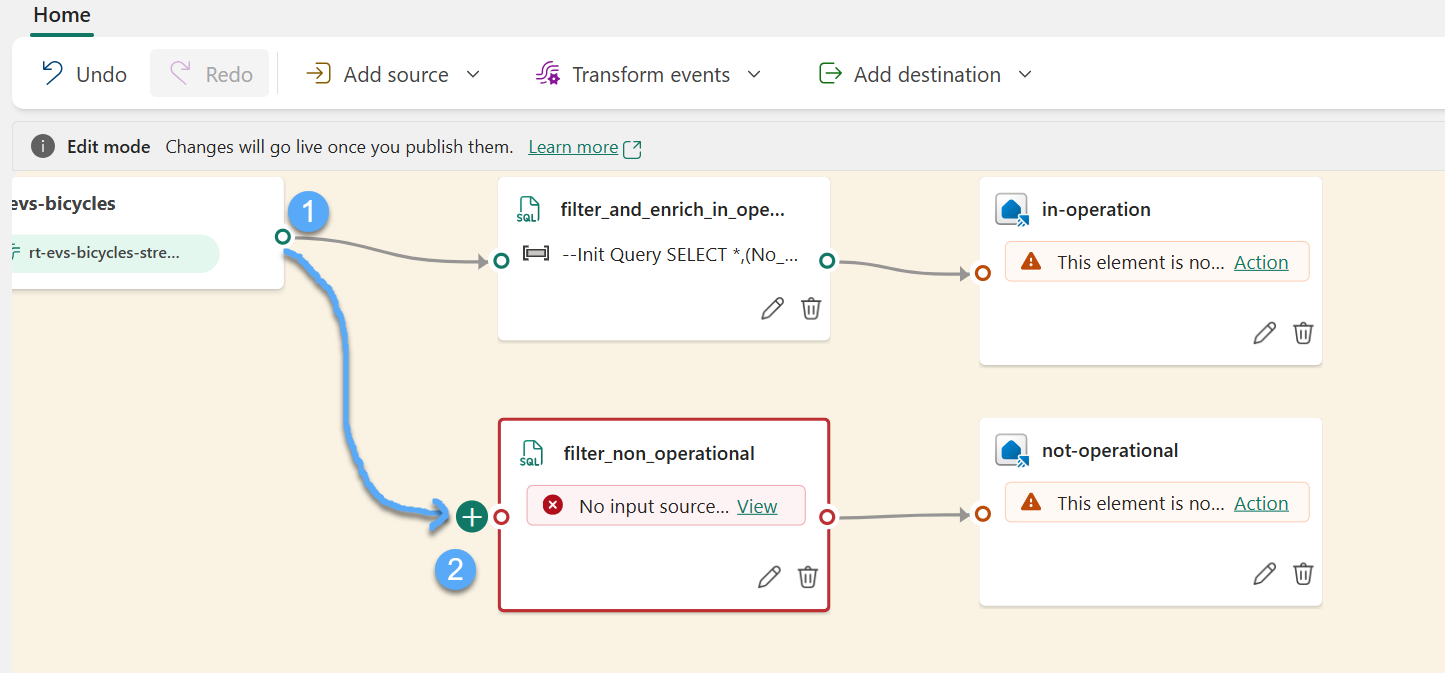
#9. Connect the stream 1️⃣ to the transform event 2️⃣ by dragging a link between the two
Task 3: Setup Eventstream Transformations destinations
In this task, you will be using transform destination to store the events into our Eventhouse KQL database created in Lab 01
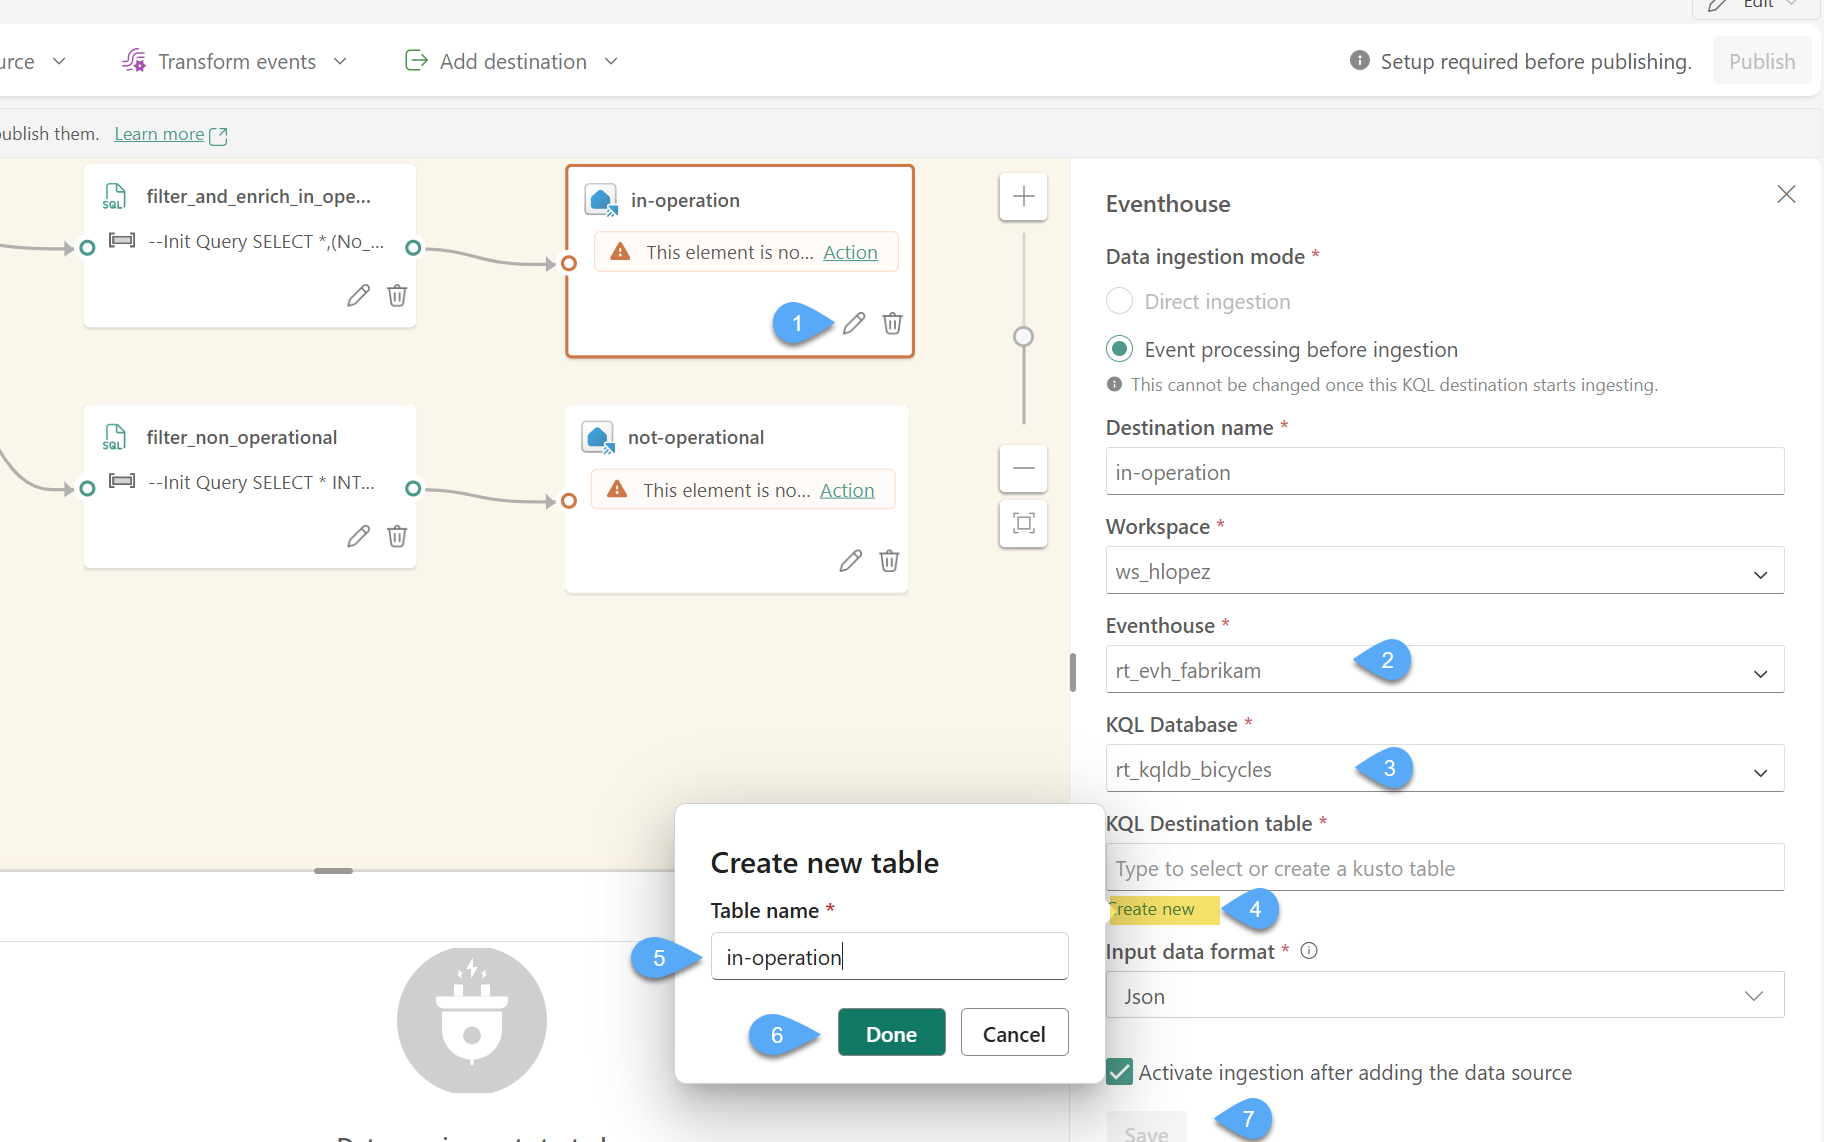
#1. From the in-operation eventhouse destination click Edit 1️⃣, select the Eventhouse rt_evh_fabrikam2️⃣, the KQL Database rt_kqldb_bicycles 3️⃣, click on Create new 4️⃣ and name the new table as in-operation 5️⃣, click Done 6️⃣ and Save 7️⃣
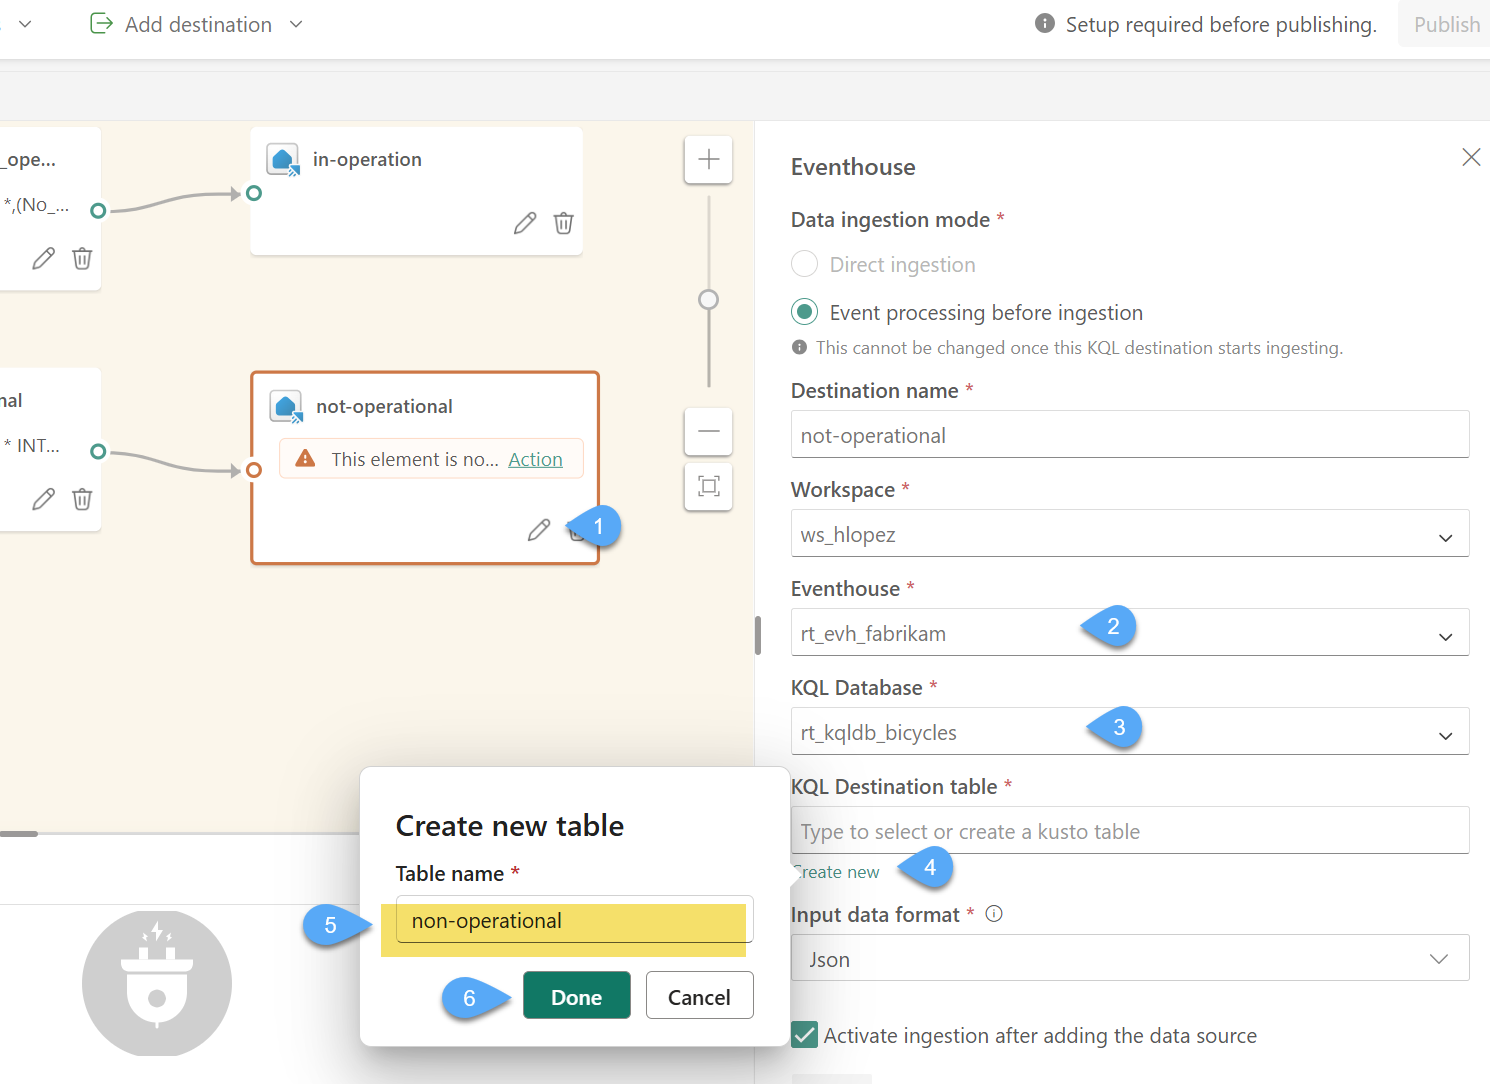
#2. From the non-operational eventhouse destination click Edit 1️⃣, select the Eventhouse rt_evh_fabrikam2️⃣, the KQL Database rt_kqldb_bicycles 3️⃣, click on Create new 4️⃣ and name the new table as non-operational 5️⃣, click Done 6️⃣ and Save 7️⃣
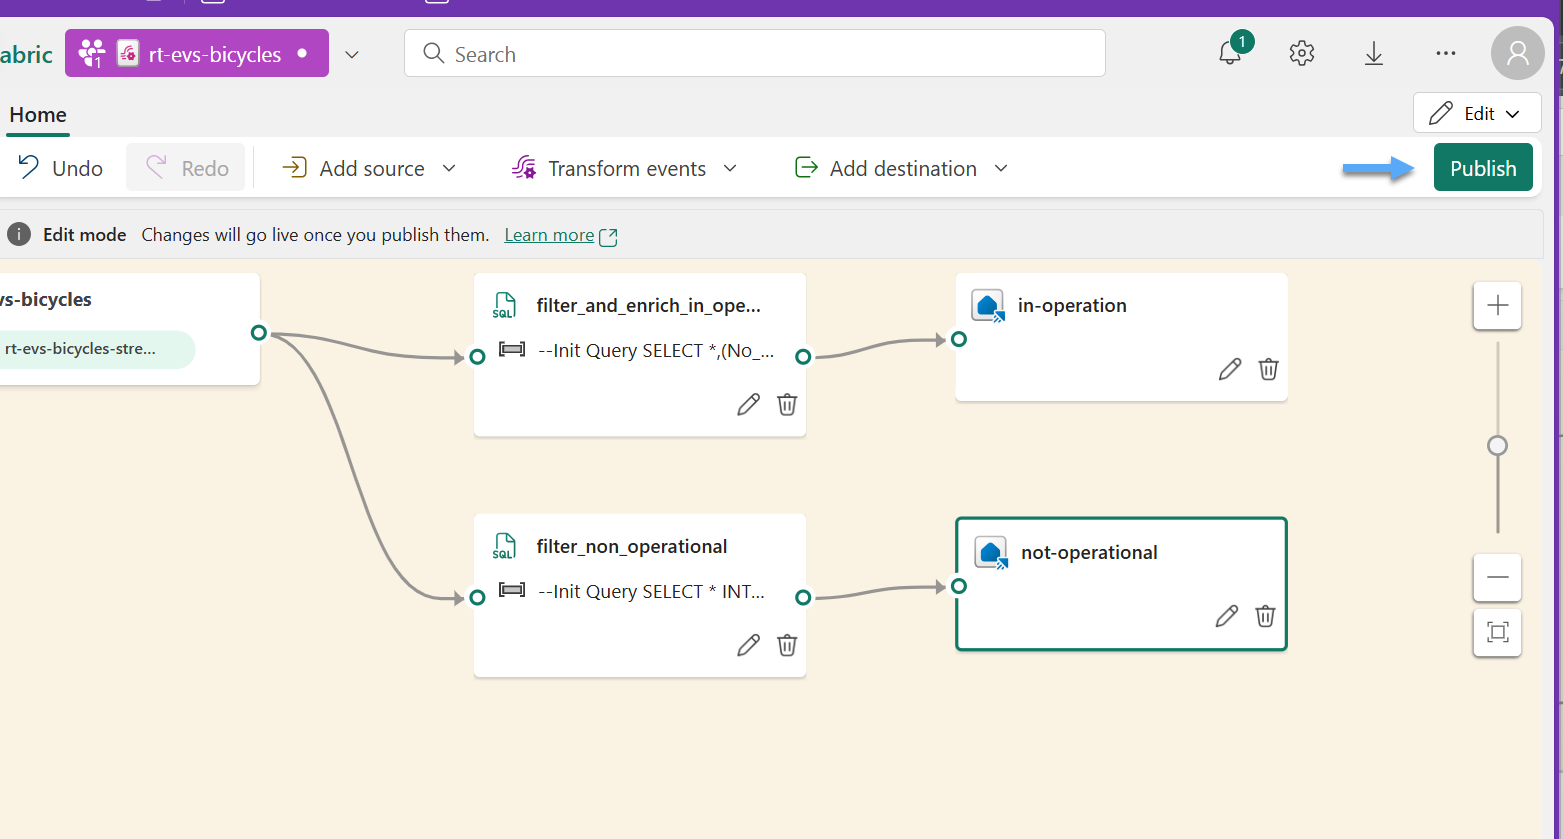
#3. Click Publish to commit the topolgy changes
#4. Wait for the status on the Eventhouse destinations change from Loading... to Active... click Refresh if necessary.
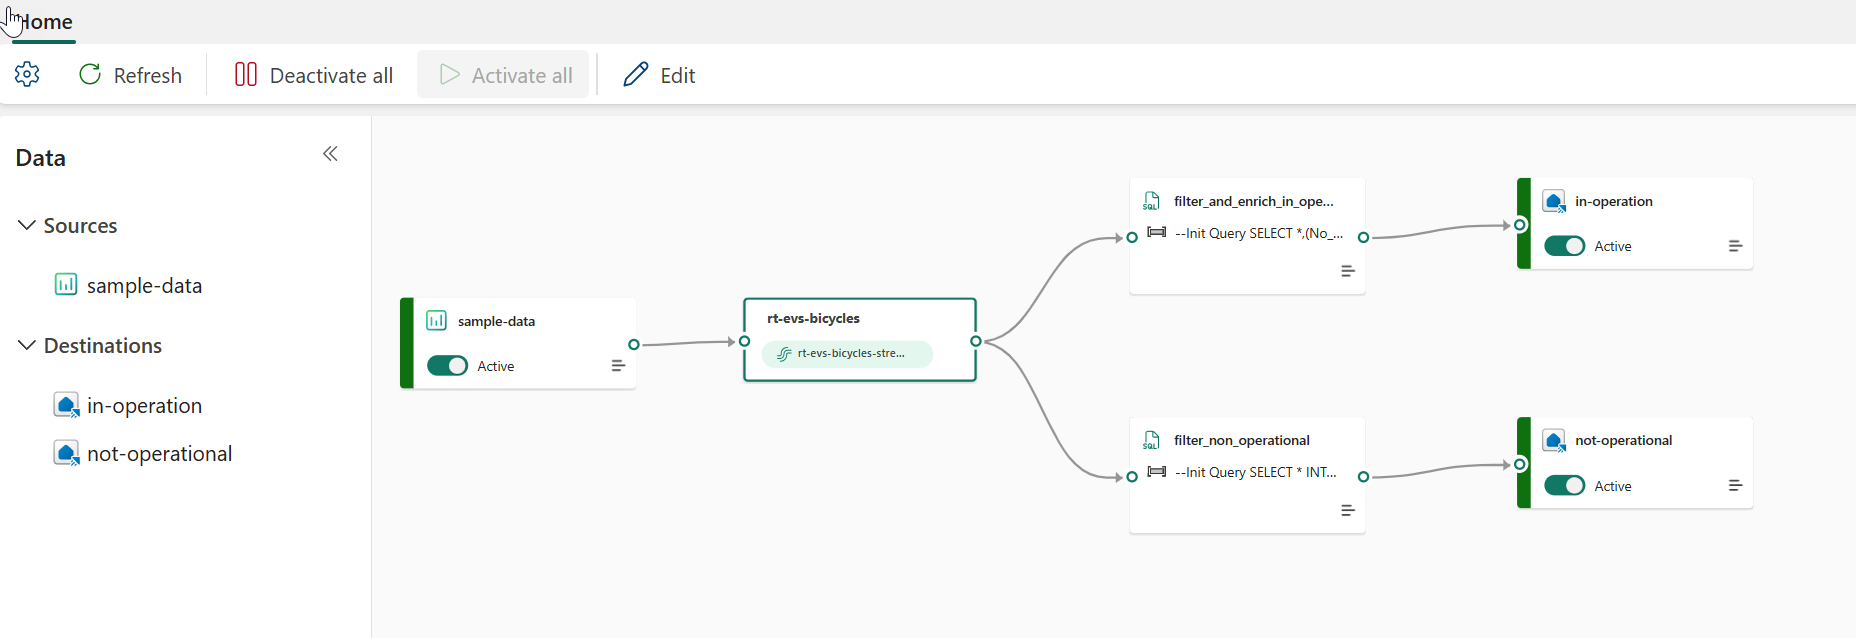
We have now a running Eventstream running and sending information to the Evenhouse KQL Database 🥳
KQL Database
Task 4: Exploring the KQL Database
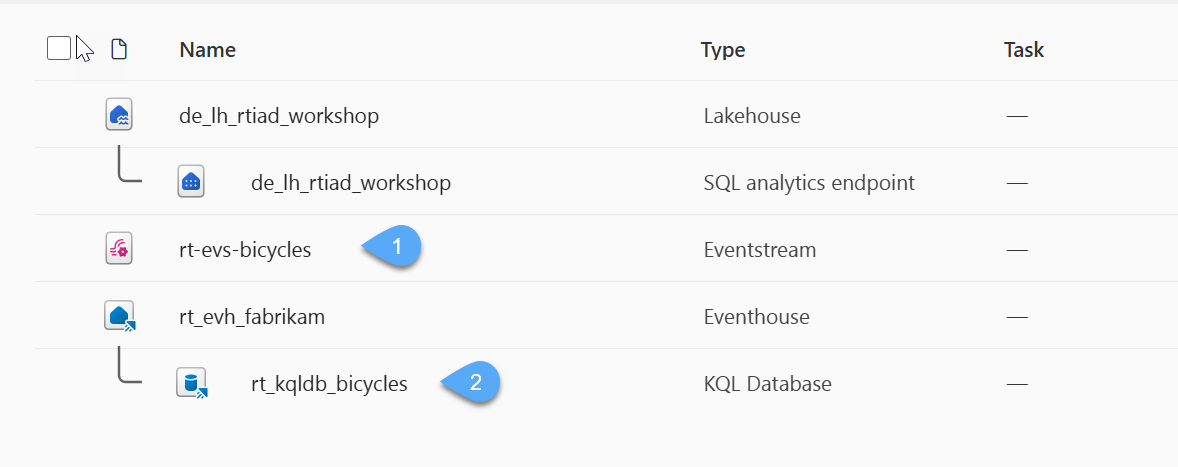
#1. Make your way back to your workspace, you should see the new Eventstream you just created 1️⃣ alongside all the Evenhouse items, open the rt_kqldb_bicycles KQL Database item 2️⃣
#2. Within this experience, you can get an overview of the current structure, size, and use of the KQL Database. Because the Eventstream is sending data to this KQL Database consistently you will notice the amount of storage will increase over time; on the right side of the screen you will see some important information about the KQL Database.
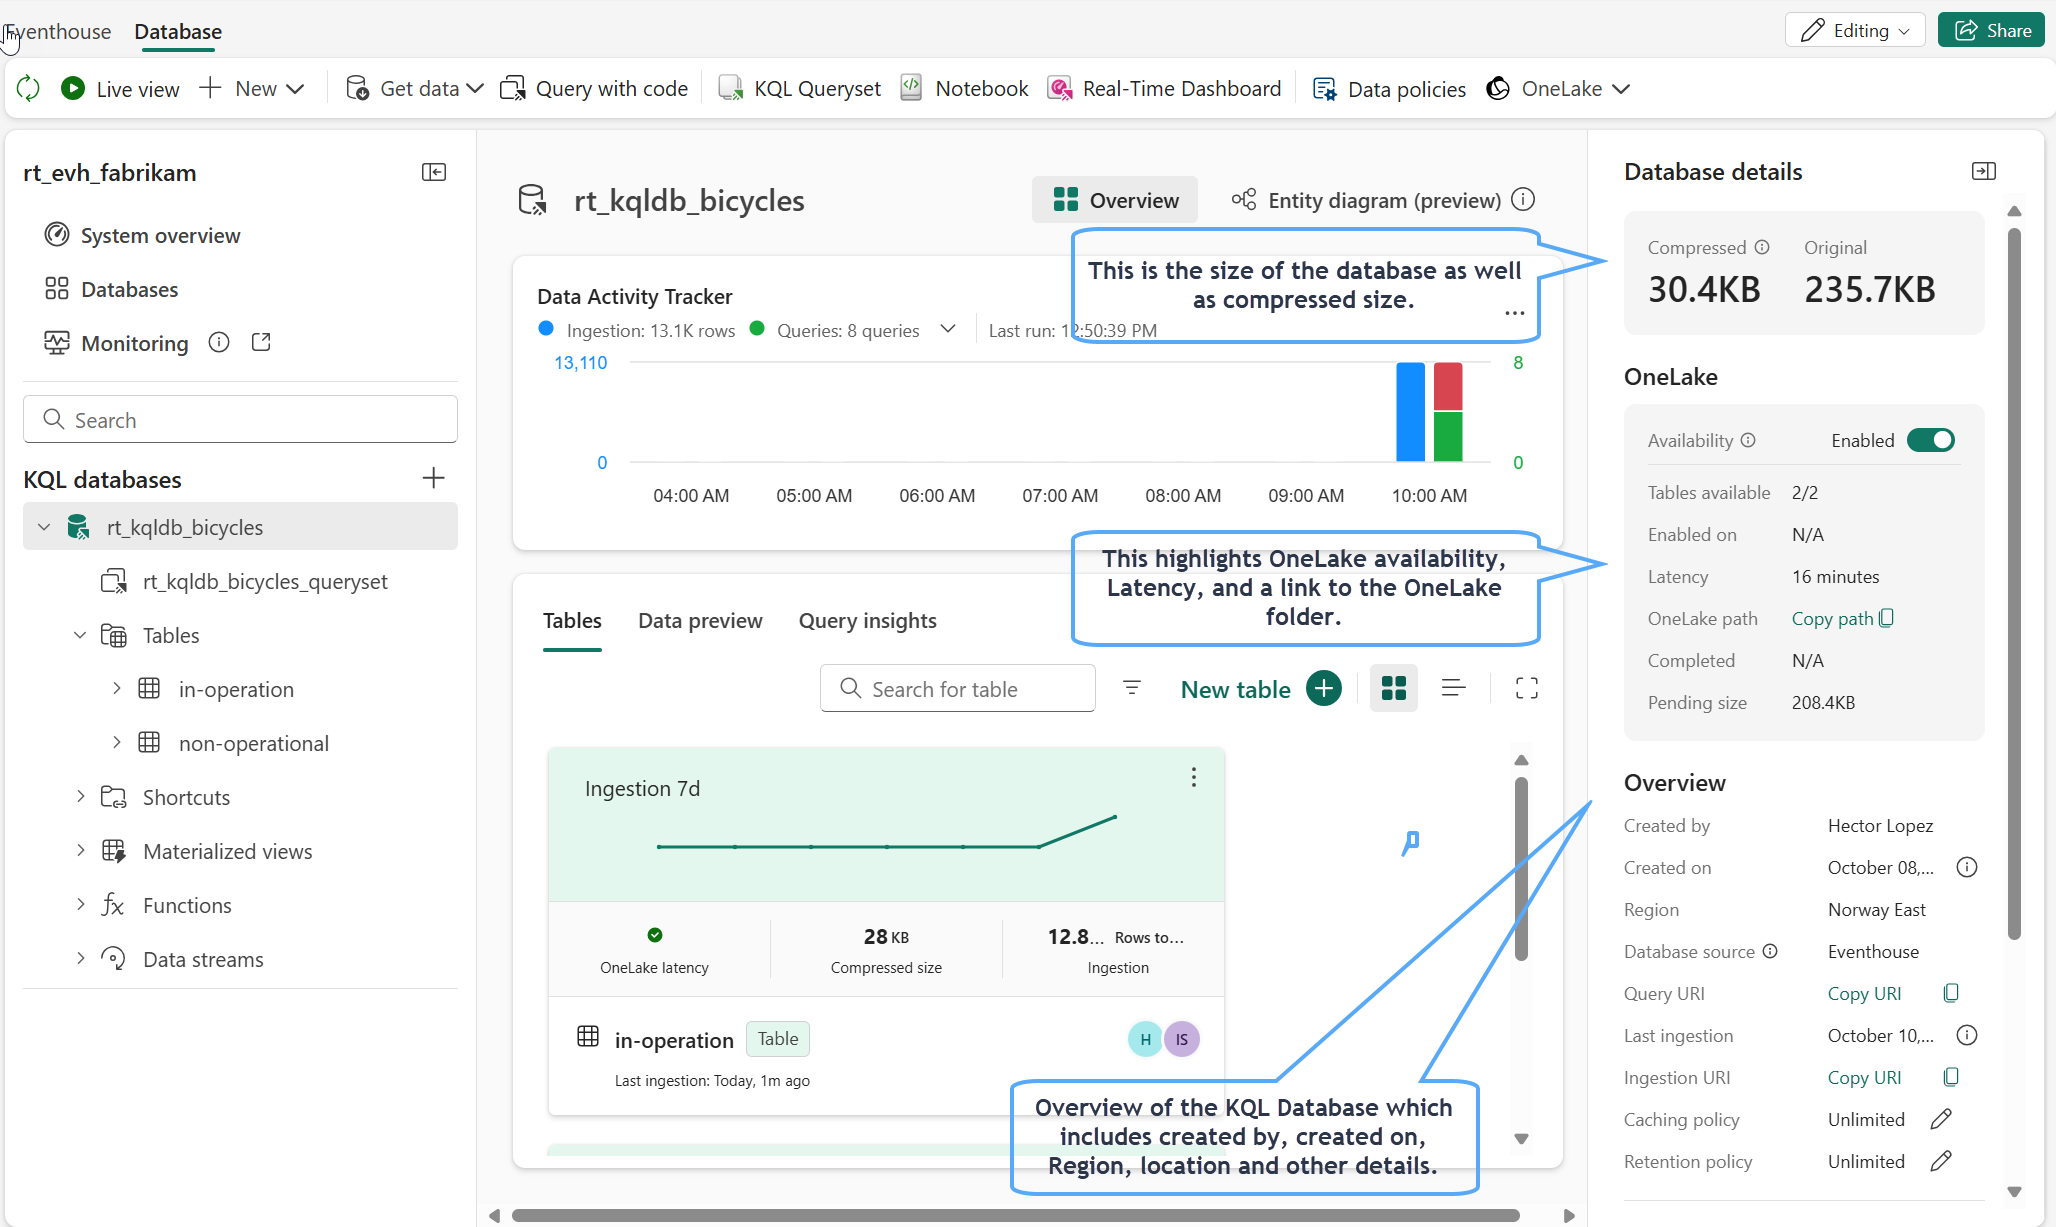
#3. Click on the refresh icon in the top-left corner of the screen, the size of the database should continue to grow - this may however take longer to show, due to the database latency. The value you see may not be exact in comparison to the screenshots in the remainder of the lab.
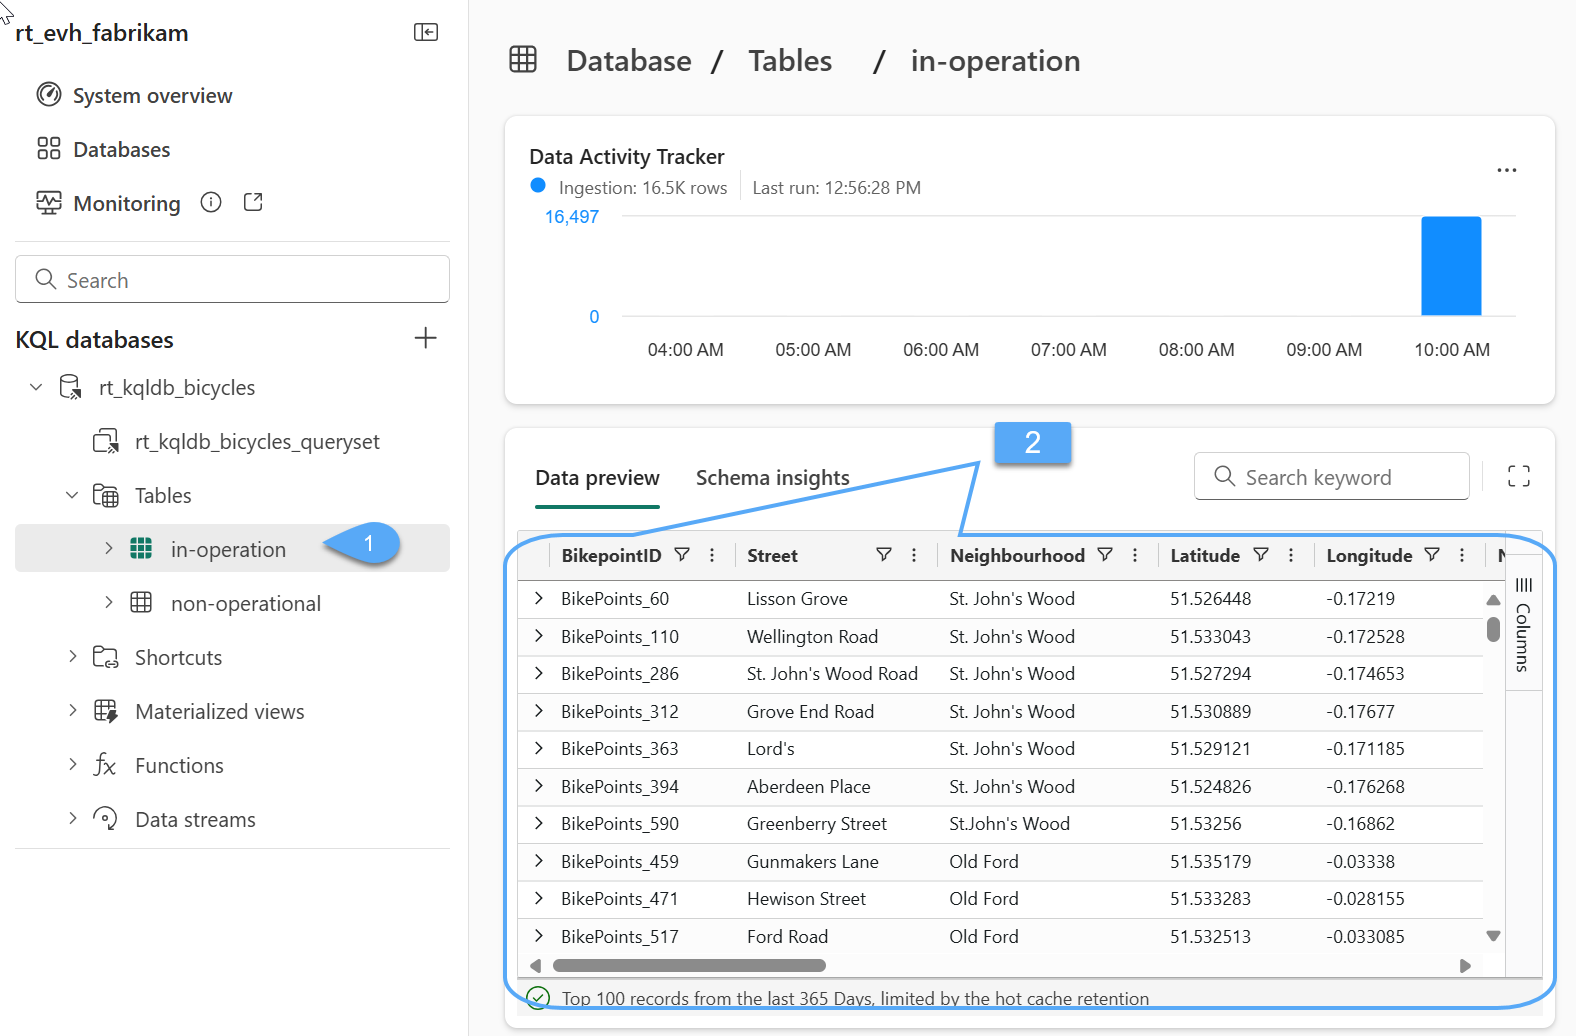
#4. Within the database navigation area on the left-hand side of the screen, click on the table within your KQL Database called in-operation 1️⃣, you will now see an overview of the table 2️⃣
Kusto Query Language (KQL)
Task 5: Learning to write KQL
#1. Let's start writing KQL! With your KQL Database selected you will see an option in the ribbon called Query with code. When selected you will be taken to the default KQL Queryset that is part of this Eventhouse and pre-populate some KQL. You can also simply select the default KQL query set that can be seen in the main panel on the left 1️⃣

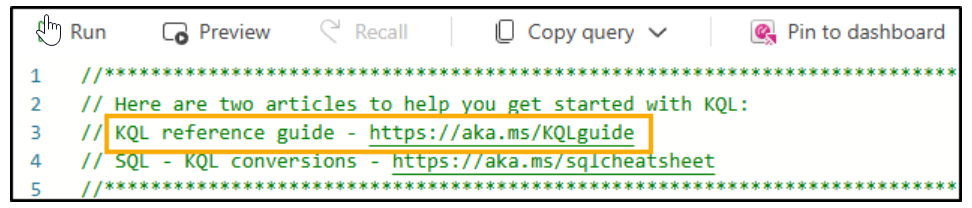
#2. You will see two links to Microsoft documentation that can be helpful when learning KQL or also looking at SQL to KQL conversions which will be discussed later throughout this class. The KQL guide is a great reference if you're learning KQL.
#3. Replace the sample queries in the queryset with the following sample queries
// Example 01 - Use COUNT to get current number of rows
['in-operation']
| count

// Example 02 - Use the TAKE along with ORDER BY
['in-operation']
| take 5
| order by No_Bikes desc

// Example 03 - Summarize the table, noticed how we're including a COUNT and SUM operations, use PROJECT to select columns
['in-operation']
| summarize NeighbourhoodCnt = count(Neighbourhood), BikeCnt = sum(No_Bikes) by Neighbourhood
| project Neighbourhood, NeighbourhoodCnt, BikeCnt
| sort by BikeCnt asc

// Example 04 - A cool feature is the ability to de-select columns using project-away!
['in-operation']
| project-away Street, Latitude, Longitude, EventProcessedUtcTime, EventEnqueuedUtcTime, PartitionId
| take 10

// Example 05 - We can also use EXTEND to add calculations to support a SUMMARIZE operation
['in-operation']
| extend ingestion_bin = bin(ingestion_time(), 1h)
| summarize BikeCnt = sum(No_Bikes) by ingestion_bin
| project  ingestion_bin, BikeCnt
| sort by BikeCnt asc

// Example 06 - We can use several where clauses, this would be the equivalent to a logical add
['in-operation']
| where No_Empty_Docks == 0
| where No_Bikes == 0

// Example 07 - The keyword order by and sort by are equivalent
['in-operation']
| summarize
        AvgOcuppancy = avg(No_Bikes/No_Empty_Docks)
    by Neighbourhood
| order by AvgOcuppancy desc

// Example 08 - We want to create a quick catalog of stations to crate a dim table
['in-operation']
| project BikepointID,Street,Neighbourhood,Region='Unknown',IsCentral=1
| distinct *
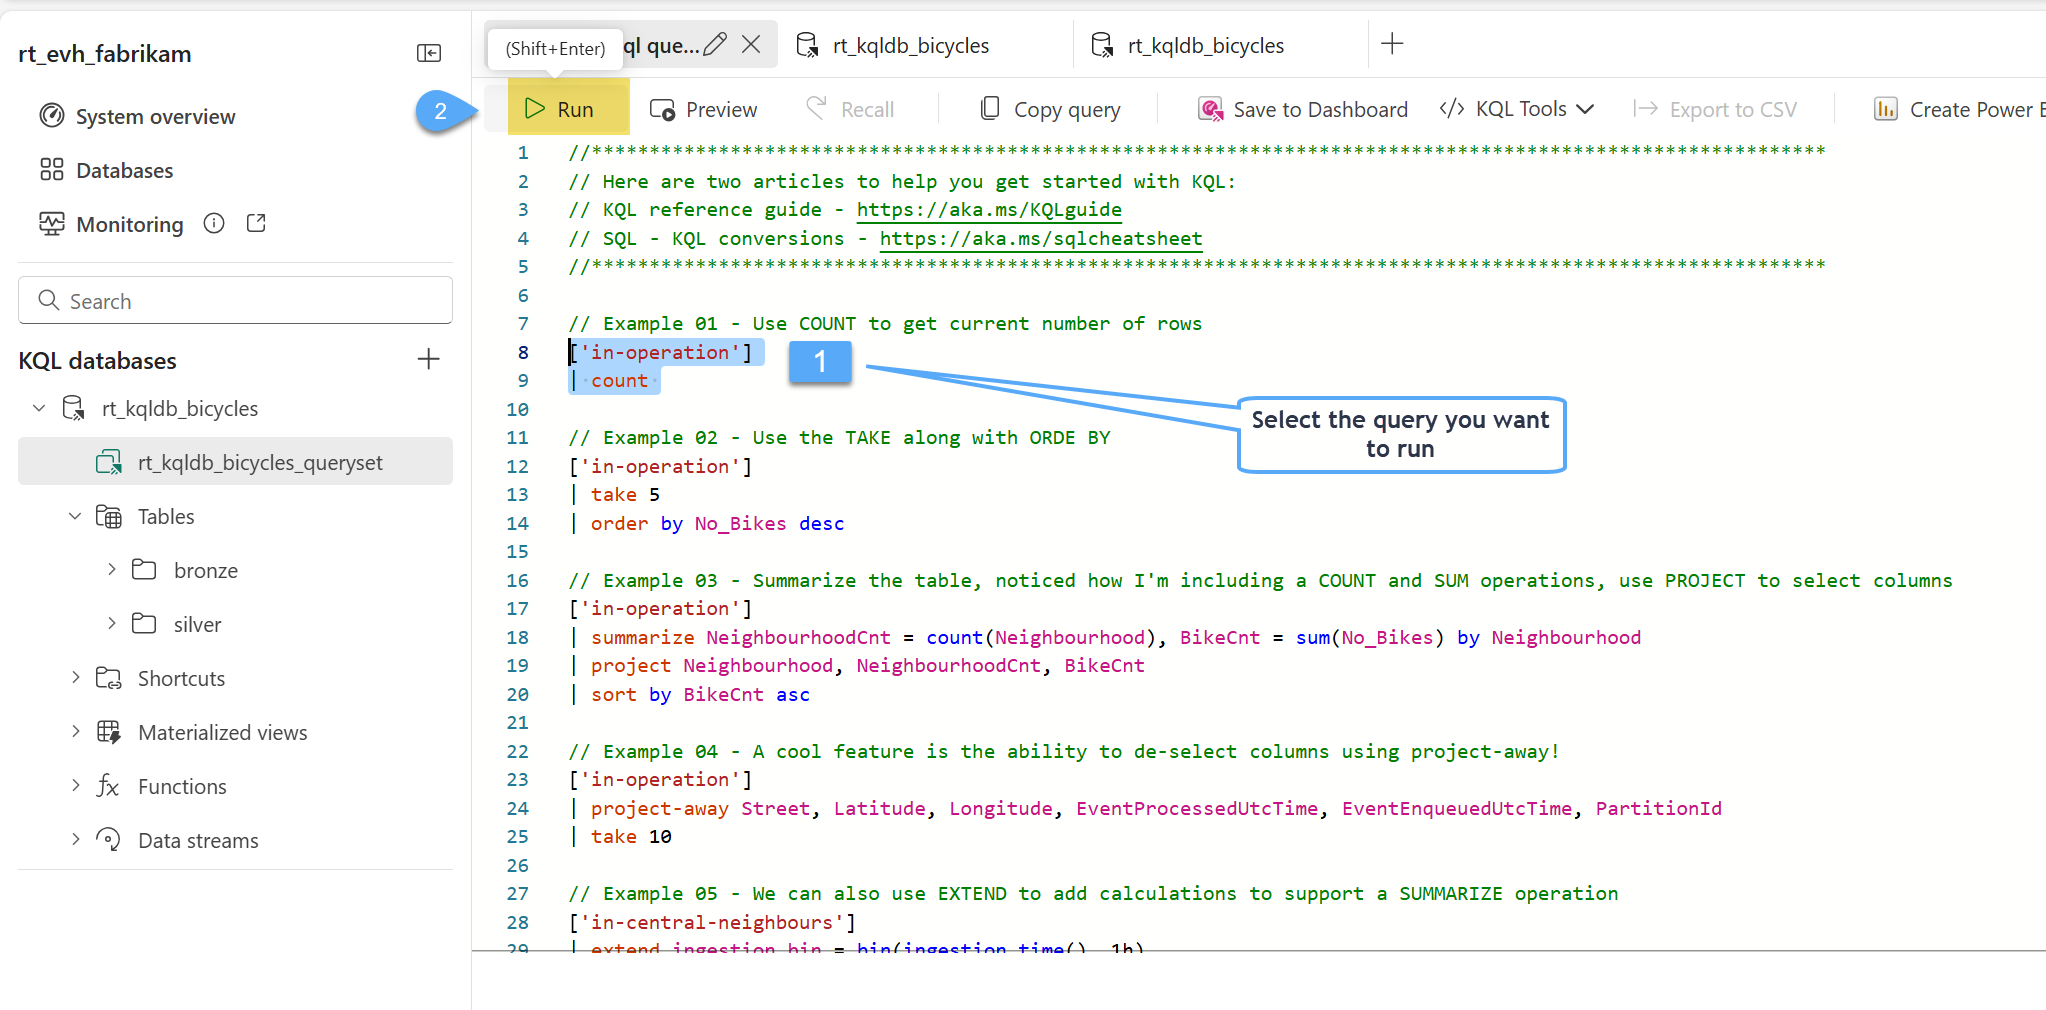
#4. Run each query individually by selecting the query 1️⃣ and click Run 2️⃣, try to udnerstand the overall structure of the queries, see the comments added to each, run and analyze the results; you'll see the structure is quite intuitive, if you have questions ... as the instructor 😁🤞
#5. Try yourself a few additional queries!
KQL Basic Operations
#Counts the records in a table
…| count

#Get a number of records (10 in this example), No actual order ensured
…| take 10

#Filtering on specific fields
…| where Timestamp > ago(10m) and UserId == ‘abcdef’

#Choose which columns to display (great if input table has dozens of columns)
…| project Col1, Col2, …

#Introduces new calculated columns
…| extend NewCol1 = Col1 + Col2

#Sorts results (also can use Order By)
…| sort by Timestamp ASC

#Render data into a visual plot while exploring
…| render timechart
Wrap-Up: What You’ve Learned
In this lab, you explored key elements of Microsoft Fabric’s Real‑Time Intelligence capabilities:
- You created an Eventstream source, learned how to connect to the bike‑rental sample stream, and reviewed timestamps like EventEnqueuedUtcTime and EventProcessedUtcTime.
- You set up streaming transformations to route events into “in‑operation” and “not‑operational” tables within a KQL database.
- You explored the KQL Database, observed streaming data flow in real time, and ran fundamental Kusto Query Language (KQL) queries to summarize and filter the data.
With your environment configured and the streaming pipeline established, you’re now ready to deepen your skills in Lab 3: Enrich your real-time data stream with external data