Lab 3: Enrich your real-time data stream with external data
Learn how to enrich your real-time streaming data with external dimension tables, organize your KQL tables with folders, and perform KQL joins to create insights by region—laying the foundation for Silver & Gold layers in the Medallion Architecture.


This is the Lab 3 out of 5 of the series...

- ⏮️ Previous Lab 2: Handle a continuous stream of real-time data
- ⏭️ Next Lab 4: Automate data ingestion and alerting with Activator
Contents
- Introduction
- Medallion Architecture
- Creating the bronze layer
- Task 1: Create KQL Database Shortcuts for Dimension tables
- Task 2: Folders for organization
- Task 3: Create table & ingest inline
- KQL Joins
- Task 4: Join tables
Introduction
In this lab, you will enrich your data stream with external data that already exists from an external source via shortcuts, organize your tables int Folders indicating layer in the medallion architecture and how to write joins in KQL
Up to this point you have been working with streaming data, but you are still missing some critical elements to be able to derive intelligence from the data you have brought in.
Medallion Architecture
The Medallion Architecture typically comprises three layers, although this can vary based on specific business requirements and challenges. In our example, we will utilize the traditional Medallion Architecture design. Let's briefly review the key points:
- Bronze Layer: This initial layer contains raw data in its original state, representing the initial data load. This layer is commonly referred to as the "raw data".
- Silver Layer: This layer is the first to be used for data analysis within an organization. Significant data enrichment and curation occur here, and it often includes data structured for optimized reporting and analysis, such as dimension and fact tables. This layer is commonly referred to as the "enriched data".
- Gold Layer: This final layer contains aggregated tables and materialized views to enhance dashboard performance. For real-time intelligence, we focus on materialized views. This layer is commonly referred to as "aggregated data".
Creating the bronze layer
Task 1: Create KQL Database Shortcuts for Dimension tables
In this task, you will bring in data that already exists from an external source via Shortcuts.
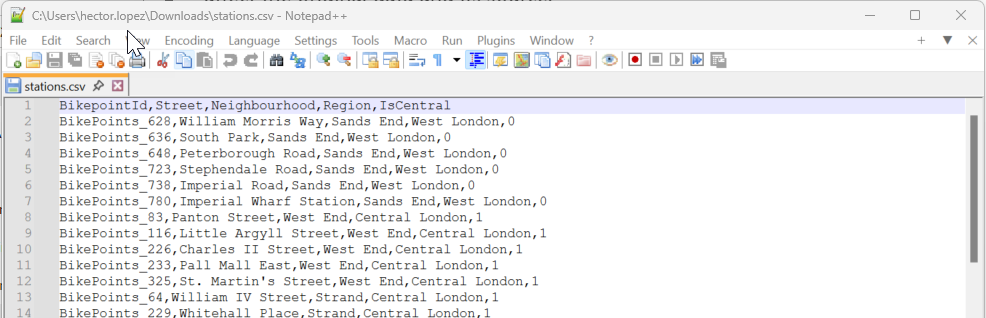
#1. Download locally the following file
It is simple CSV file that contain the relation between bike stations and the regions they belong to! This will help us to summarize the data by Region, we are also including another important information, that is, whether the bike station is in Central London or not, again, this information would allow us to extend our analysis over the stream data.
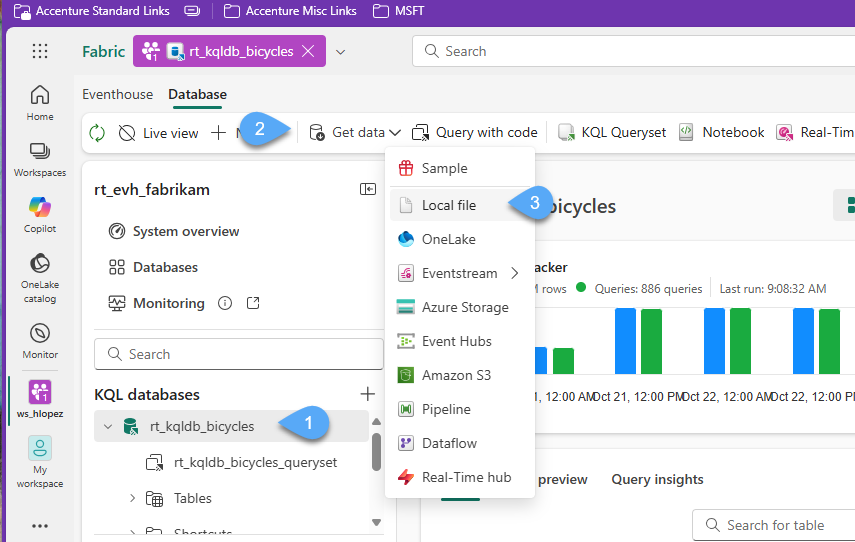
#2. In the rt_kqldb_bicycles KQL database 1️⃣, click + Get Data 2️⃣ and select Local file 3️⃣
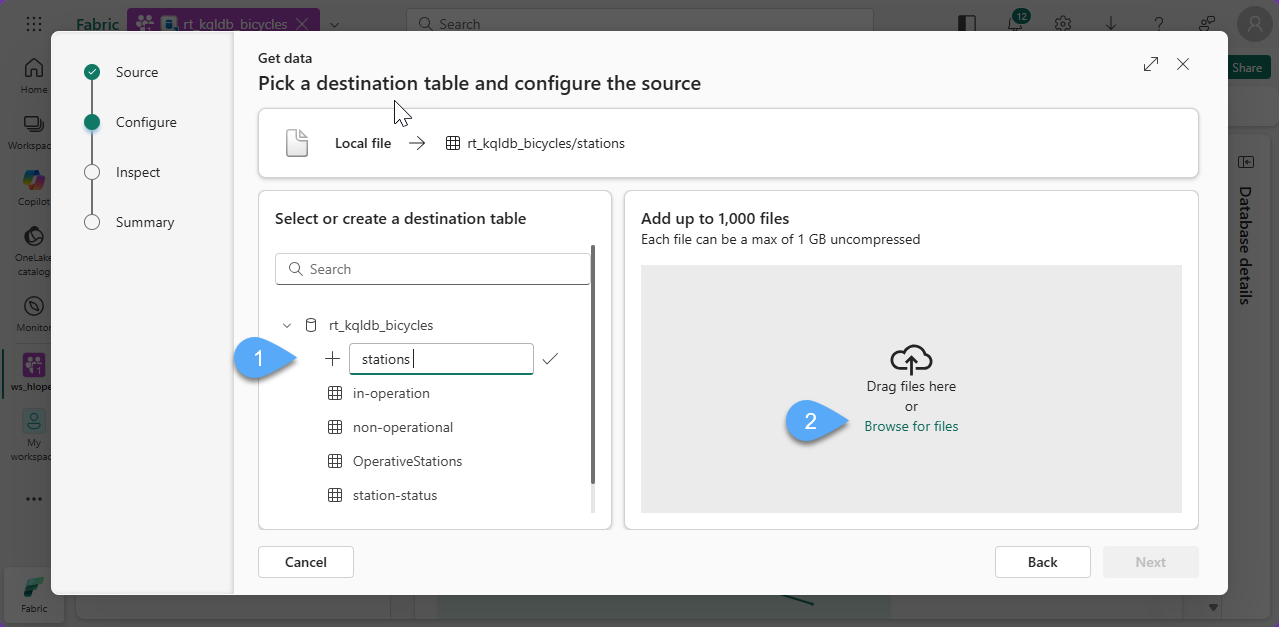
#3. Click + New Table and give the name stations 1️⃣, click on Brose for files and choose the file downloaded in Step #1.
#4. Click Next
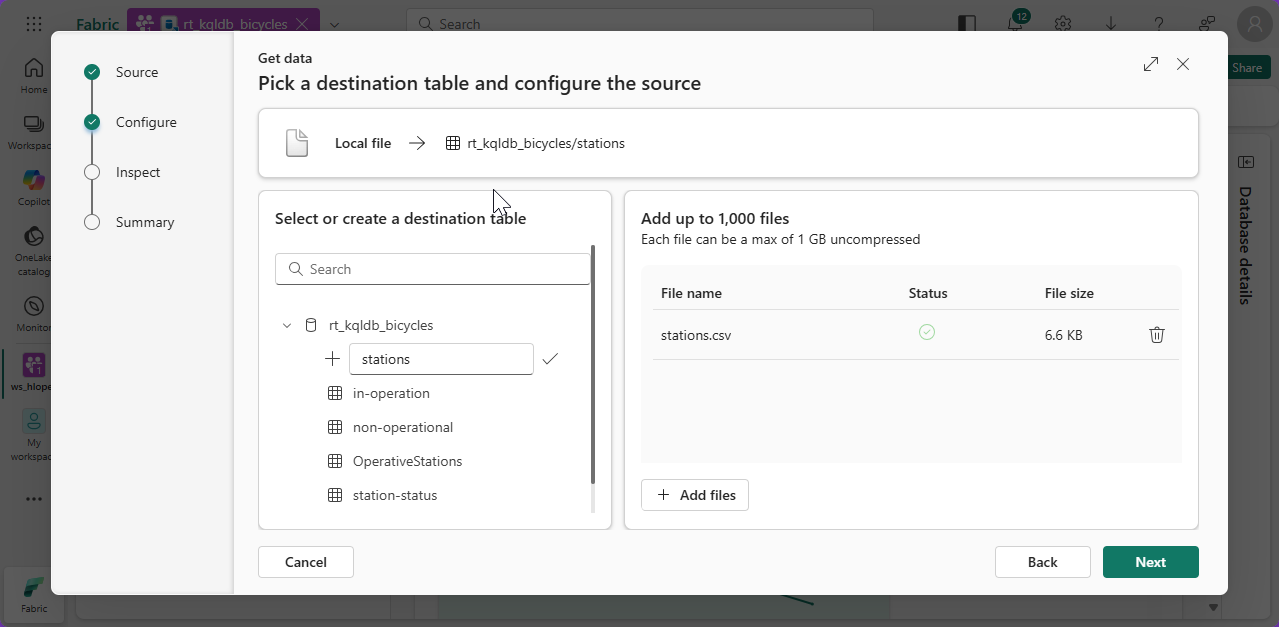
#5. Make sure the toggle button Fist row header is On and click Finish
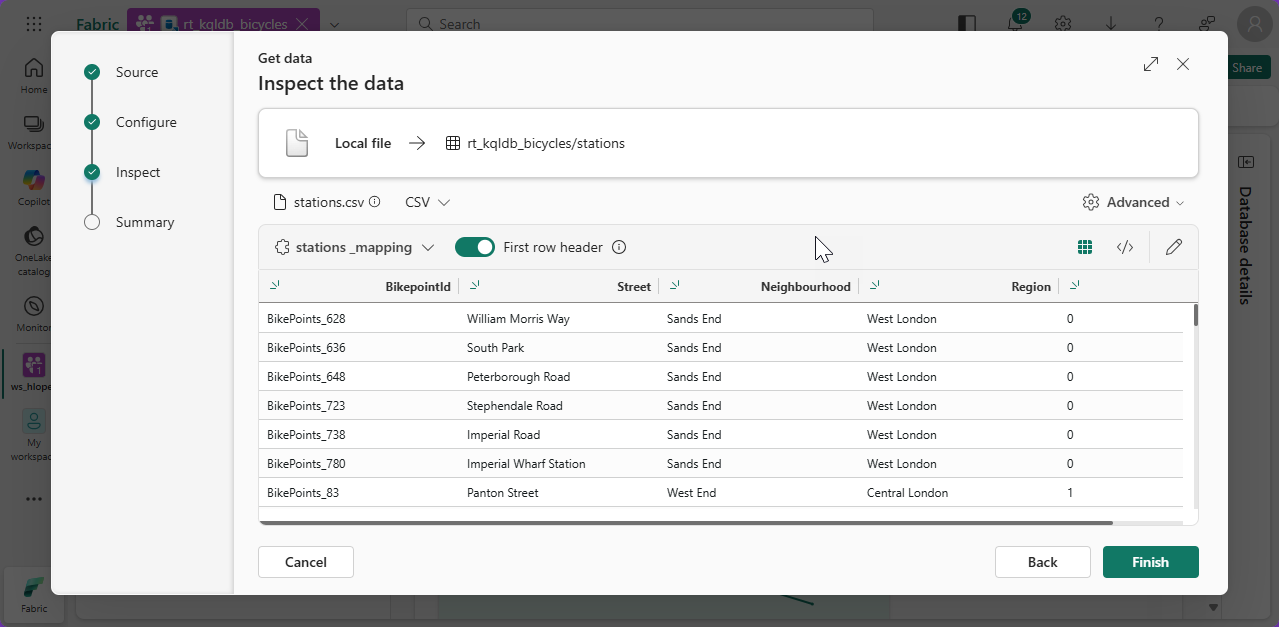
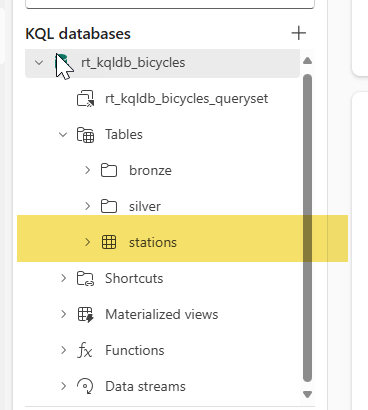
#6. Wait for the process to comple and click Close, you should be able to see the table created
Task 2: Folders for organization
In KQL Database, you use folders to organize tables within the different layers of the Medallion Architecture to enhance both clarity and efficiency.
Limitations:
- Folders are used for organization purposes only, they are not physical, they are not used for security.
- Folders cannot be created through the UI, tables are assigned to folders through KQL, you will see examples of folder assignment in this section.
#1. In the KQL database 1️⃣ select the option labeled KQL Queryset 2️⃣. This will create a new Queryset separate from the default one available in the Eventhouse. This can be useful for organizational purposes
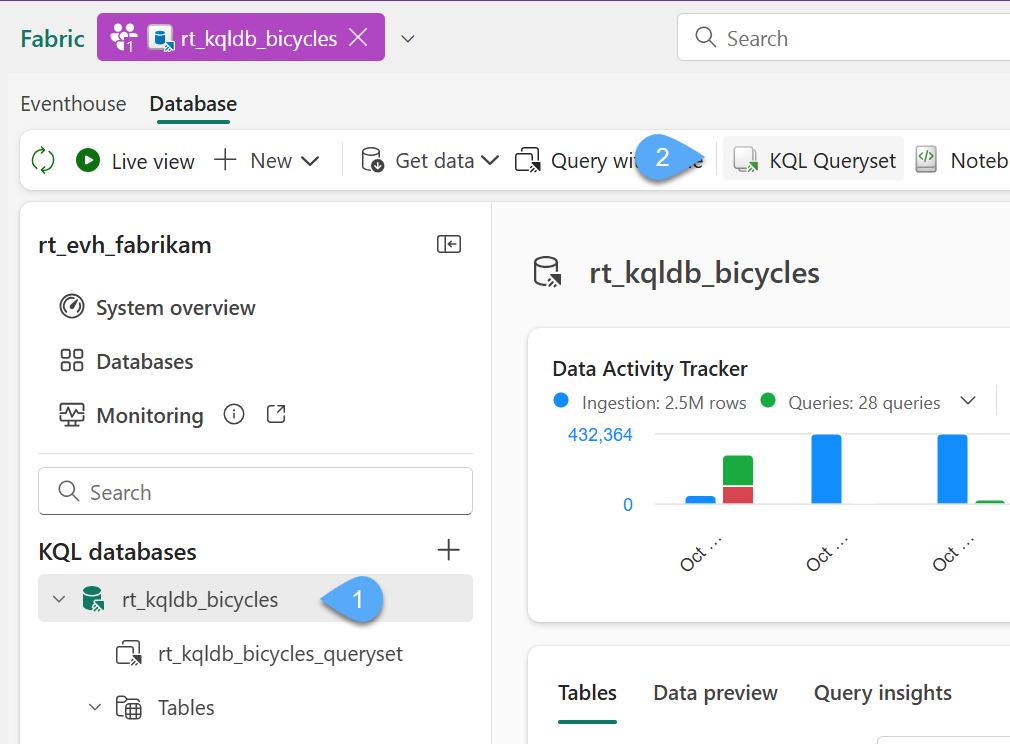
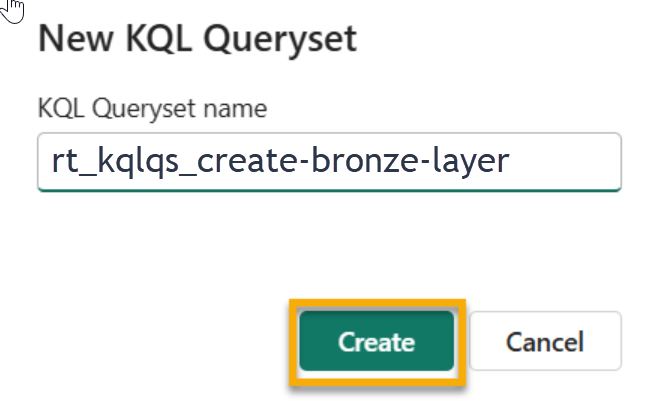
#2. Name the Queryset rt_kqlqs_create-bronze-layer and then click Create.
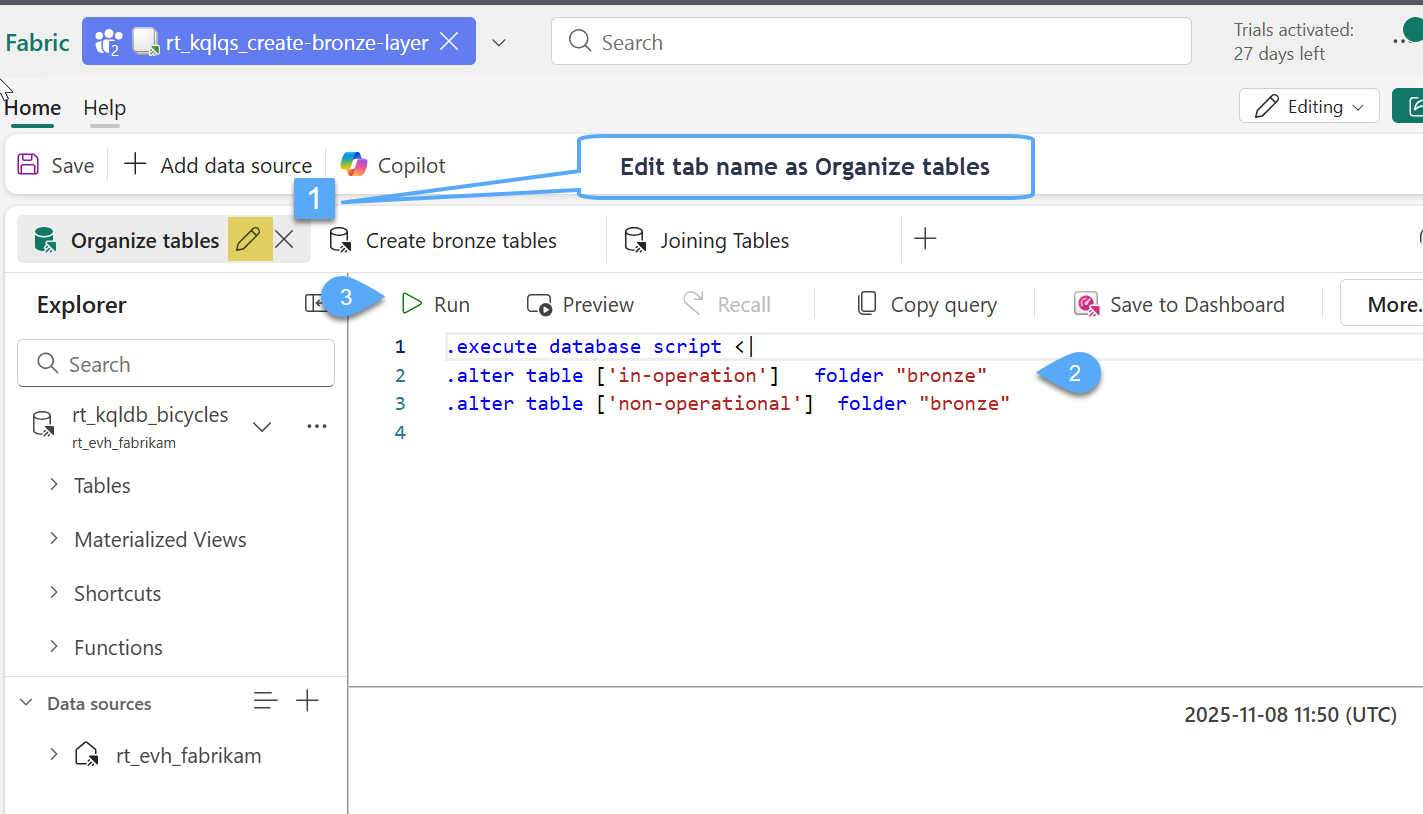
#3. In the new interface rename the default tab as Organize tables 1️⃣, replace the sample code with the following script 2️⃣ and click Run 3️⃣
//Move raw streaming tables to 'bronze' folder
.execute database script <|
.alter table ['stations']   folder "bronze"
.alter table ['in-operation']   folder "bronze"
.alter table ['non-operational']  folder "bronze"
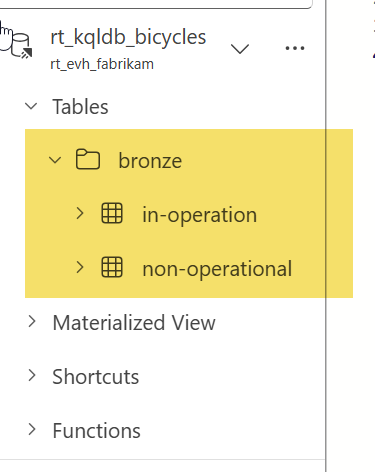
#4. In your explorer you will now see a new folder called "bronze" and your two raw streaming tables will be organized inside that folder.
Task 3: Create table & ingest inline
In this example, you're enriching your streaming dataset by manually creating a small reference table called station-status within the "bronze" folder of your KQL database. This table contains inline data representing operational statuses for stations, with each status assigned a key and a descriptive name. You're using the .create table command to define the schema, followed by .ingest inline to insert the values directly.
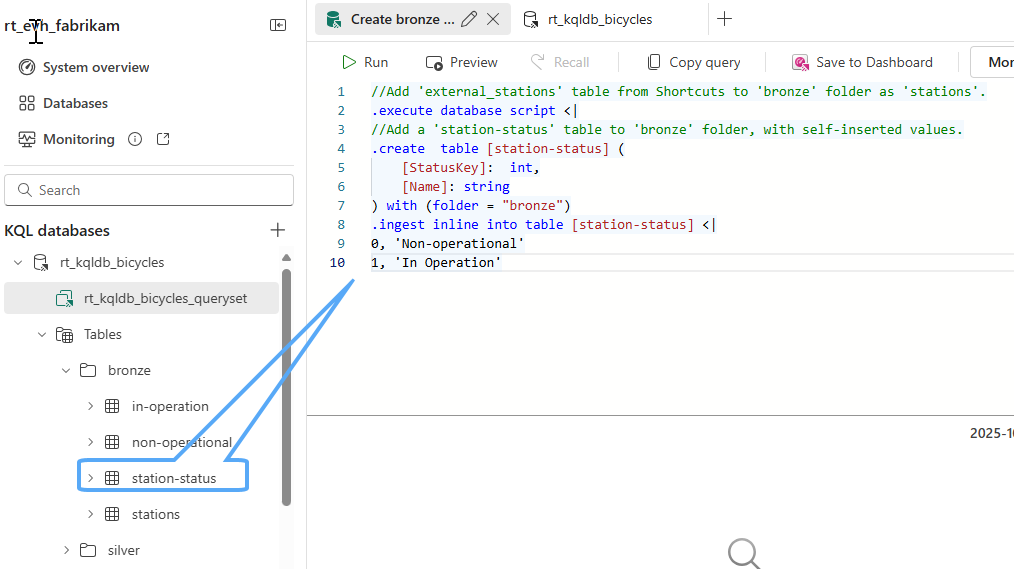
#1 Within the queryset rt_kqlqs_create-bronze-layer, create a new tab and rename the new tab as Create bronze tables 1️⃣, replace the sample code with the following script 2️⃣ and click Run 3️⃣
//Add 'external_stations' table from Shortcuts to 'bronze' folder as 'stations'.
.execute database script <|
//Add a 'station-status' table to 'bronze' folder, with self-inserted values.
.create  table [station-status] (
    [StatusKey]:  int,
    [Name]: string
) with (folder = "bronze")
.ingest inline into table [station-status] <|
0, 'Non-operational'
1, 'In Operation'
#2. Now our bronze layer is almost ready for the next step which is moving the data to the "Enriched" silver layer
KQL Joins
In lab 2, you learned a lot about the structure of KQL and how to write various queries. One thing we did not cover in lab 2 was how to write joins in KQL; similar to SQL, KQL (Kusto Query Language) supports several types of joins, including inner join, leftouter join, rightouter join, and fullouter join. The basic syntax for performing a join in KQL is as follows:
- Below is a quick description of the various types of joins supported in KQL:
- Inner Join: Returns only the rows that have matching values in both tables.
- Left Outer Join: Returns all rows from the left table and the matched rows from the right table. Unmatched rows from the left table will have nulls for columns from the right table.
- Right Outer Join: Returns all rows from the right table and the matched rows from the left table. Unmatched rows from the right table will have nulls for columns from the left table.
- Full Outer Join: Returns all rows when there is a match in either left or right table. Unmatched rows will have nulls for columns from the other table.
Task 4: Join tables
#1. Within the queryset rt_kqlqs_create-bronze-layer, create a new tab and rename the new tab as Joining tables 1️⃣, replace the sample code with the following script 2️⃣ and click Run 3️⃣
// Inner join 'in-operation' with 'station' and get number of records per region.
['in-operation']
| join kind = inner (stations) on $left.BikepointID == $right.BikepointId and $left.Neighbourhood == $right.Neighbourhood
| summarize avgBikeUsageRate = avg(BikeUsageRate), sumNoBikes = sum(No_Bikes) by Region
| project Region, avgBikeUsageRate, sumNoBikes
| order by Region
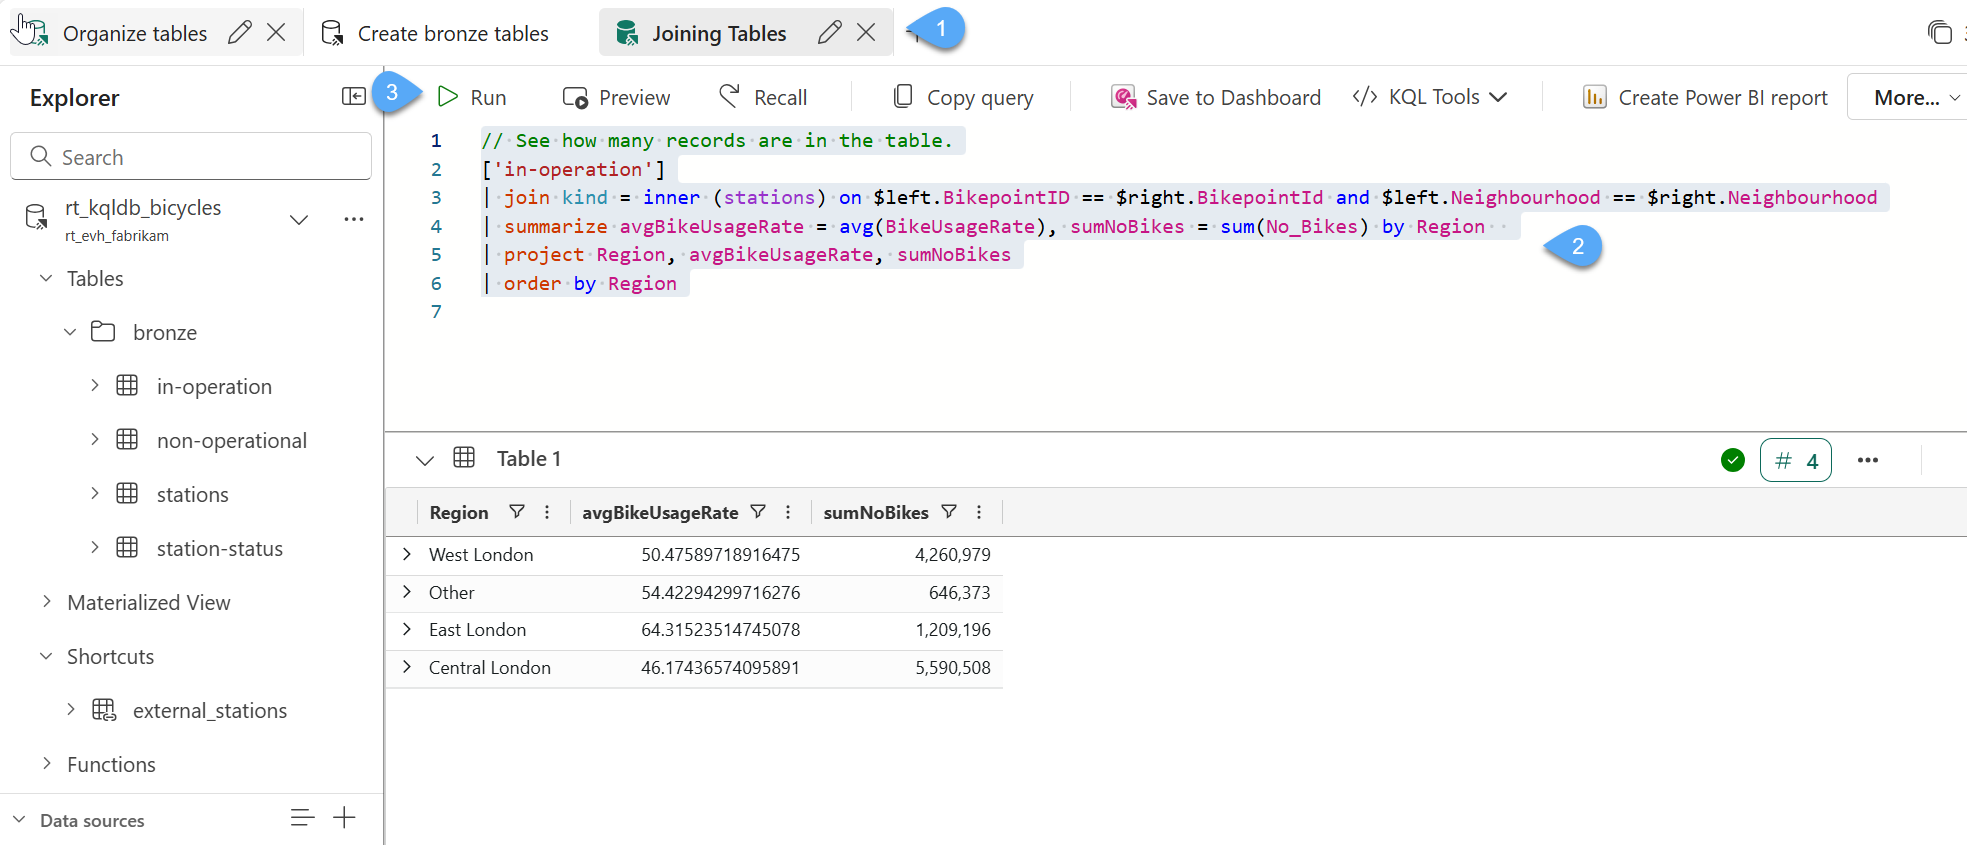
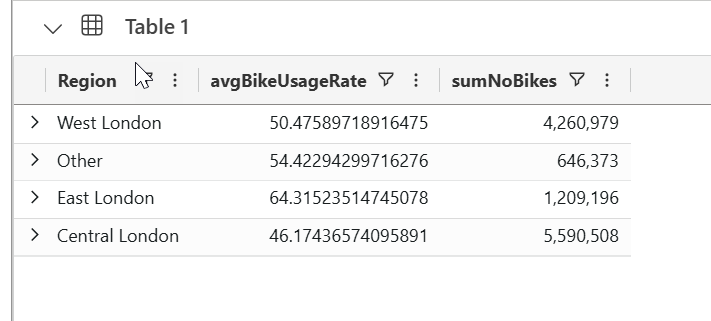
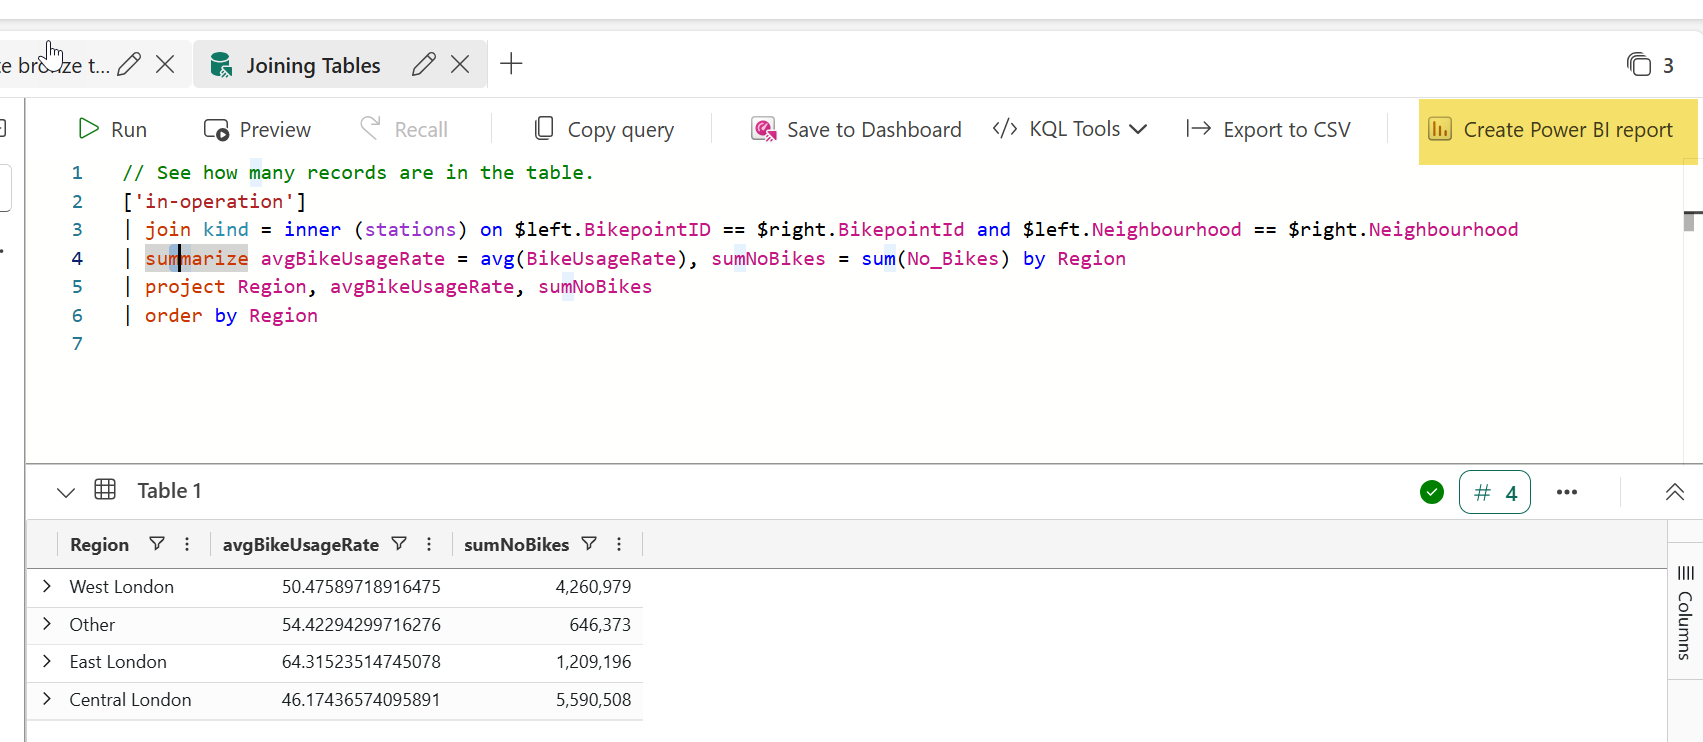
#2. This query performs a join from all stations In-Operation with Stations table to obtain aggregated data by Region ... below you will see the results of the query; click on Save to preserve all queries in the Queryset.
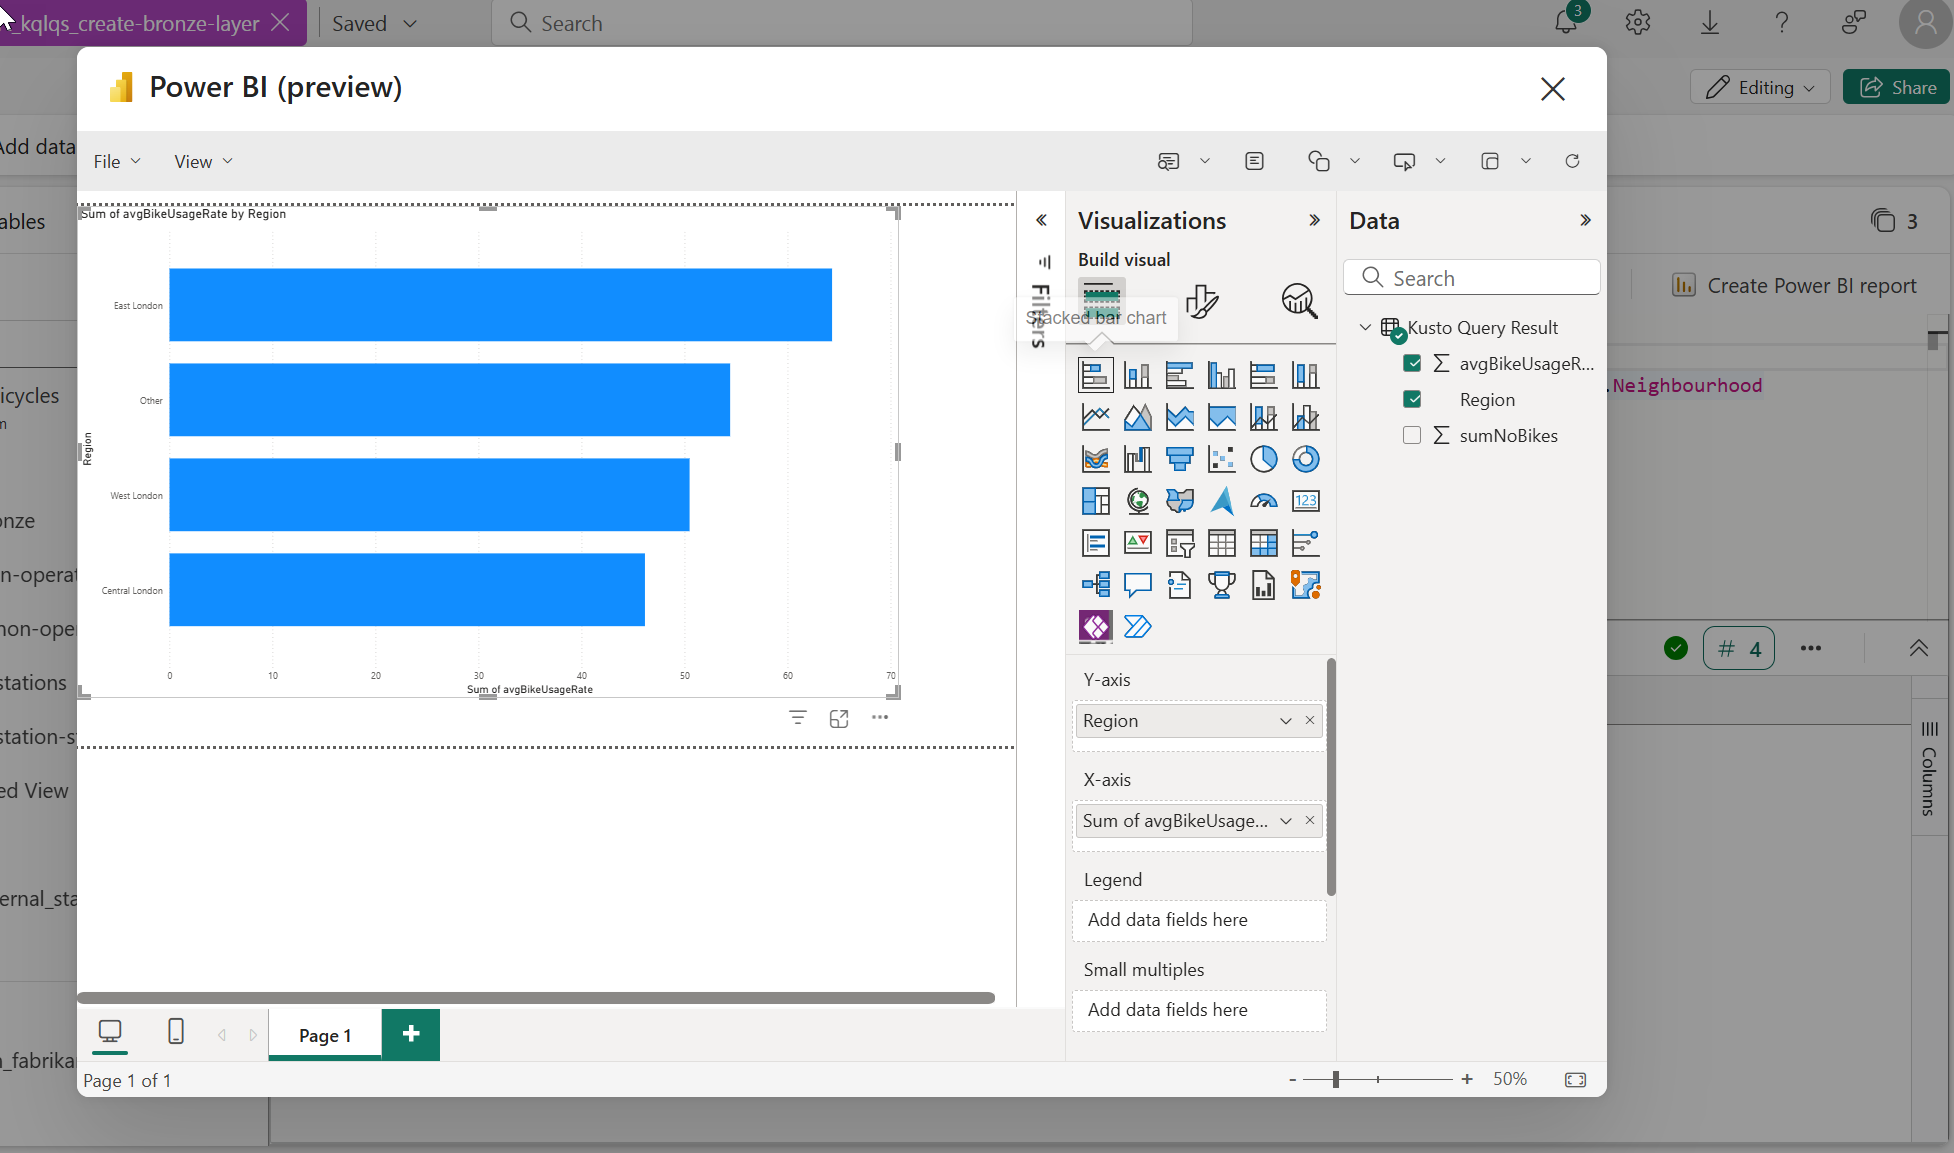
#3. Next, let's look at how to quickly visualize this result within Power BI. With your query highlighted click on the button in your toolbar, Create Power BI report.
#4. This gives you the opportunity to create a Power BI report using the data within your KQL Database. Feel free to explore this for a few moments, but you will not need to create a report from this data just yet. Click the X button in the top-right corner when you are ready to move on to the next lab.
Wrap‑Up: What You’ve Learned
In this lab, you’ve taken your streaming data pipeline to the next level:
- You reviewed the Medallion architecture and how it applies to real‑time data workflows.
- You created dimension tables and shortcuts in your KQL database to enrich your stream with external data and organized your environment by placing tables into folders that correspond to each layer of the architecture for clarity and structure.
- You explored how to write KQL joins (inner, outer, full) to combine streaming data with enrichment tables and generate aggregated insights by region.
- With the enriched datasets and join queries in place, you’re ready to build the Silver and Gold layers for deeper analytics, readying for dashboards and alerting.
➡️ Up next: Lab 4 – Set up an alerting system with Activator — learn how to trigger real‑time alerts when station availability thresholds are crossed and take immediate action.